
- Title
-
Hedgehog signaling plays a cell-autonomous role in maximizing cardiac developmental potential
- Authors
- Thomas, N.A., Koudijs, M., van Eeden, F.J., Joyner, A.L., and Yelon, D.
- Source
- Full text @ Development
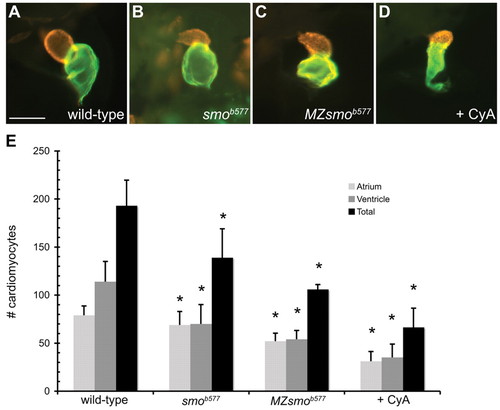
Embryos with reduced Hedgehog signaling have small cardiac chambers. (A-D) Lateral views of zebrafish hearts stained with MF20 (red) and S46 (green) antibodies to visualize the ventricle and atrium at 48 hpf. MF20 marks the entire heart and S46 is atrium specific. In these superimposed images, the MF20+S46+ atrial tissue appears green and the MF20+S46- ventricle is red. Scale bar: 100 μm. (A) Wild-type heart. (B-D) Zygotic smob577 mutant, MZsmob577 mutant and CyA-treated hearts have small, misshapen ventricles and atria. (E) Quantification of cardiomyocyte number in wild-type, smob577, MZsmob577 and CyA-treated embryos at 52 hpf. See Materials and methods for cell counting technique. Values represent the mean cell number for each category (±s.d.). Asterisks indicate statistically significant differences from wild type (P<0.0001 for all except the smob577 atrium where P=0.01). |
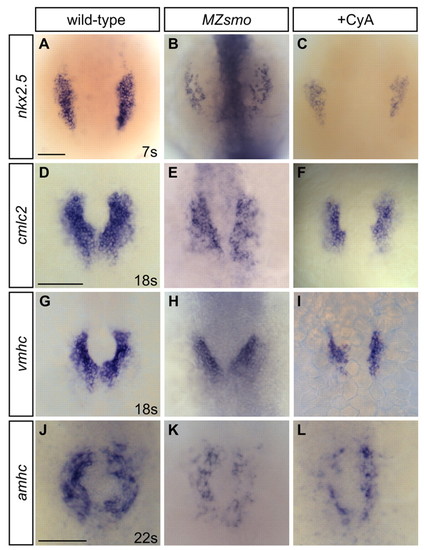
Hedgehog signaling promotes the initial establishment of cardiomyocytes. (A-L) In situ hybridization detects expression of myocardial markers. Dorsal views, anterior towards the top. Scale bars: 100 μm (bar in D applies to D-I). MZsmo mutant and CyA-treated embryos exhibit reduced expression of (A-C) nkx2.5 at the seven-somite stage, (D-F) cmlc2 at the 18-somite stage, (G-I) vmhc at the 18-somite stage and (J-L) amhc at the 22-somite stage. EXPRESSION / LABELING:
PHENOTYPE:
|
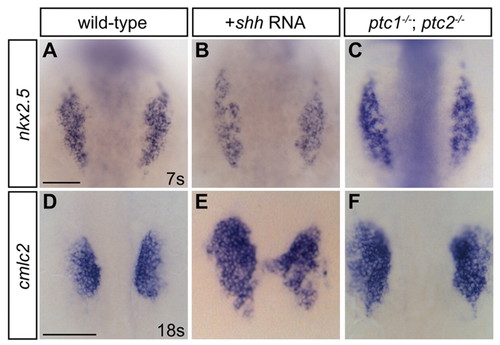
Increased Hedgehog signaling expands cardiomyocyte numbers. (A-F) Dorsal views, anterior towards the top. Scale bars: 100 μm. (A-C) nkx2.5 expression at the seven-somite stage is subtly expanded in shh-injected and ptc1;ptc2 double mutant embryos. The observed extent of anterior-posterior enlargement was variable. (D-F) cmlc2 expression at the 18-somite stage is expanded in shh-injected and ptc1;ptc2 double mutant embryos. The degree of expansion was variable and frequently coupled with disorganized morphology of migrating cardiomyocyte populations, as in E. EXPRESSION / LABELING:
PHENOTYPE:
|
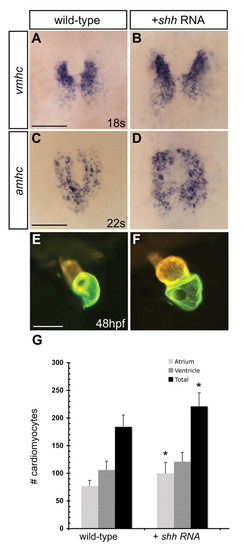
Increased Hh signaling expands ventricular and atrial populations. (A-D) Dorsal views, anterior towards the top. (A,B) vmhc expression at the 18-somite stage and (C,D) amhc expression at the 22-somite stage are expanded in shh-injected embryos. (E,F) At 48 hpf, shh-injected embryos often exhibit enlarged hearts, as indicated by MF20/S46 immunofluorescence. Scale bars: 100 μm. (G) Quantification of cardiomyocyte number in wild-type and shh RNA-injected embryos at 52 hpf. Values represent the mean cell number for each category (±s.d.). Asterisks indicate statistically significant differences from wild type (P≤0.0005). EXPRESSION / LABELING:
PHENOTYPE:
|

Hedgehog signaling activity is required early for the formation of the appropriate number of cardiomyocytes. (A) Quantification of the number of vmhc-expressing cells per bilateral heart field at the 18-somite stage, comparing control embryos with embryos treated with CyA beginning at the indicated stages. Values represent the mean cell number for each category (±s.d.). Asterisks indicate statistically significant differences from controls (P<0.004). (B) Representative images of vmhc expression at the 18-somite stage in control embryos and embryos exposed to CyA beginning at the indicated stages. (C) Quantification of the impact of inhibiting Hh signaling during defined time windows on the number of vmhc-expressing cells. CyA was added at dome stage and removed at indicated stages. CyA control embryos were exposed continually between the dome and 18-somite stages. Asterisks indicate statistically significant differences from ethanol controls (P<0.0024). Double asterisks indicate that a treatment also results in a statistically significant difference from CyA controls (P<0.001). (D) Representative images of vmhc expression in embryos treated as indicated. EXPRESSION / LABELING:
PHENOTYPE:
|
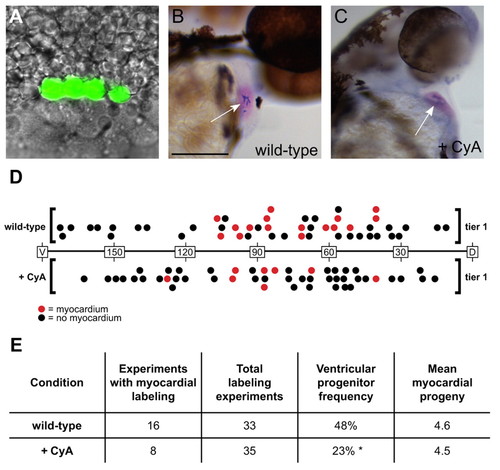
Embryos with reduced Hedgehog signaling contain fewer myocardial progenitors. (A) Example of a 40% epiboly embryo in which four adjacent blastomeres in the first row above the embryonic margin (tier 1) were labeled by photoactivation of caged fluorescein-dextran. Fluorescein is pseudocolored in green and superimposed on a DIC image. (B,C) 48 hpf embryos with labeled contributions to ventricular myocardium. (B) Six labeled cardiomyocytes found within a wild-type ventricle. Scale bar: 100 μm. (C) Five labeled cardiomyocytes found within a CyA-treated ventricle. Myocardium is visualized via in situ hybridization for cmlc2 (pink) and labeled cells are marked in blue (arrows). (D) 40% epiboly myocardial fate maps of tier 1 blastomeres in wild-type and CyA-treated embryos. Wild-type fate map is shown above the horizontal axis and CyA-treated fate map is shown below the axis. Longitude coordinates of the margin are depicted with dorsal as the origin (0°) and ventral as 180°. Each circle represents an individual labeling experiment. Red circles represent experiments in which the labeled blastomeres contributed to ventricular myocardium, and black circles represent embryos in which the labeled cells did not become cardiomyocytes. The position of each circle indicates the median longitude value of the labeled blastomeres. Experiments from the left and right sides are merged for convenience of presentation. (E) Results from fate-mapping experiments conducted 50°-125° from dorsal, the region within tier 1 where ventricular myocardial progenitors are found. A ratio of the number of experiments yielding labeled ventricular myocardium to the total number of experiments was used to determine the ventricular progenitor frequency. Asterisk indicates a statistically significant difference from wild-type (P=0.0418, Fisher's exact test). The mean number of myocardial progeny per embryo was determined by counting labeled cardiomyocytes in relevant cases (see Table S5 in the supplementary material). |
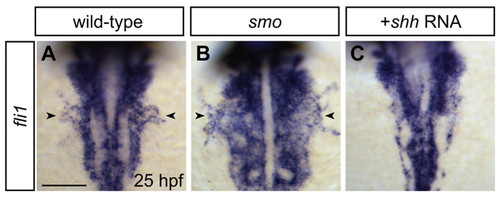
Altered Hedgehog signaling affects development of the common cardinal vein. (A-C) In situ hybridization detects expression of the endothelial gene fli1 at 25 hpf. Dorsal views, anterior towards the top. Scale bar: 100 μm. (A) Formation of the common cardinal vein (CCV, arrowheads) is evident bilaterally in wild-type embryos. (B) CCV (arrowheads) is expanded in smo mutants. (C) CCV is absent in shh-injected embryos. |

Hedgehog signaling is required cell autonomously for effective contribution to myocardium. (A) Transplantation results. Expression of Tg(cmlc2:egfp) in host embryos at 48 hpf indicated myocardial contribution. A ratio of hosts with donor-derived cardiomyocytes to all host embryos screened was used to determine myocardial contribution frequency. Asterisk indicates a statistically significant difference from wild type (P=0.0346, normal approximation of the χ2 test). (B) Wild-type donor-derived cells expressing Tg(cmlc2:egfp) in wild-type host myocardium at 48 hpf. (C) Superimposed bright-field and fluorescent images. Scale bar: 100 μm. (D) MZsmo donor-derived cardiomyocyts expressing Tg(cmlc2:egfp) in wild-type host myocardium. (E) Superimposed bright-field and fluorescent images. (F,G) Wild-type and MZsmo donor-derived skeletal fast muscle cells marked with fluorescein lineage tracer in wild-type host. Scale bar: 100 μm. (H) Donor cell incorporation into skeletal fast muscle lineage, scored at 48 hpf. |
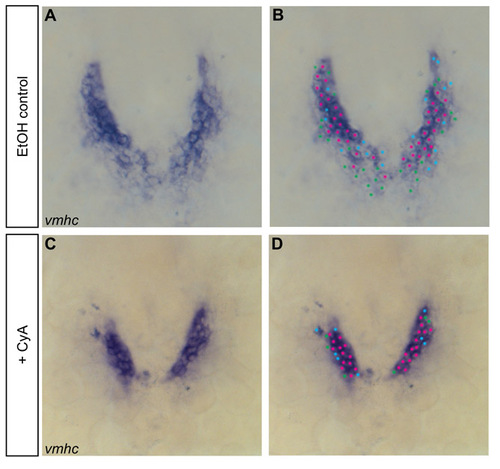
Example of the cell counting technique used to quantify cardiomyocytes at 18-somite and 22-somite stages. (A-D) In situ hybridization detects vmhc expression at the 18-somite stage. Dorsal views, anterior towards the top. In cell counting experiments, the number of cardiomyocytes expressing the gene of interest is determined by marking each cell containing NBT/BCIP precipitate. (A,C) Individual cells are easily identified and quantified as the staining is excluded from the nucleus; nuclei are counted if surrounded by precipitate. (B,D) In these examples, the most intensely stained cells are marked with pink dots, the faintest cells are marked with green dots and the intermediate cells are marked with blue dots. All marked cells are included in the total cell count. |
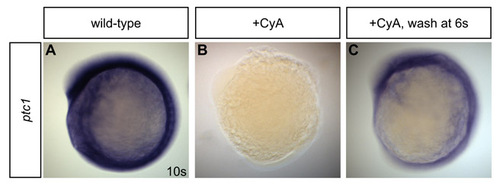
Inhibition of Hedgehog signaling by cyclopamine treatment is reversible. (A-C) In situ hybridization detects ptc1 expression at the 10-somite stage. Lateral views, anterior towards the top. (A) Robust ptc1 expression is detected at the 10-somite stage in ethanol-treated wild-type embryos. (B) By contrast, ptc1 expression is undetectable in embryos exposed to CyA from the dome stage until the 10-somite stage. (C) Expression of ptc1 is evident in embryos that were exposed to CyA from dome stage until the six-somite stage; following washout at the six-somite stage, embryos were allowed to develop until the 10-somite stage. |
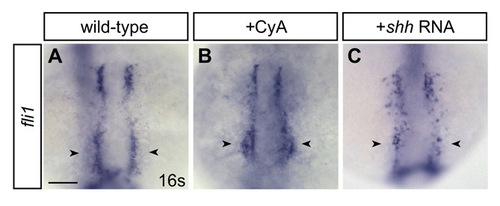
Changes in fli1 expression in embryos with altered Hh signaling. (A-C) In situ hybridization detects expression of the endothelial gene fli1 at the 16-somite stage. Dorsal views, anterior towards the top. Scale bar: 100 μm. (A,B) A subset of anterior endothelial progenitors (arrowheads) appears subtly expanded in CyA-treated embryos. (C) Loss of some anterior endothelial progenitors (arrowheads) is evident in shh-injected embryos. |