
- Title
-
Multiple upstream modules regulate zebrafish myf5 expression
- Authors
- Chen, Y.H., Wang, Y.H., Chang, M.Y., Lin, C.Y., Weng, C.W., Westerfield, M., and Tsai, H.J.
- Source
- Full text @ BMC Dev. Biol.
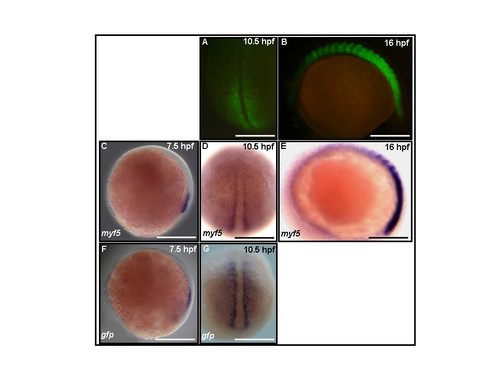
Green fluorescent protein (GFP) expression in Tg(myf5(80K):GFP) transgenic embryos recapitulates endogenous myf5 expression in muscle precursors. GFP fluorescence is detected in the presomitic mesoderm of embryos by 10.5 hours postfertilization (hpf) (A), in the somites and the presomitic mesoderm in 16 hpf embryos (B). Endogenous myf5 transcripts (C,D,E) and GFP mRNA (F,G) were detectable at 7.5, 10.5, and 16 hpf. (A,D,G) Dorsal views, rostral to the left; (B,C,E,F) side views, rostral to the left, dorsal to the top. Scale bars: 100 μm in all panels. EXPRESSION / LABELING:
|

Tg(myf5(80k):GFP) transgenic embryos express green fluorescent protein (GFP) in both slow and fast muscle fibers. (A,B) GFP expression in somites labeled with the F59 antibody. White dash lines indicate the location of head. (B) Higher magnification view of the boxed region shown in A. (C-E) Cross-section along the plane indicated by the white line in panel (B). GFP signals are observed in both fast (C, green signals) and slow muscle fibers (F, yellow signals). (A,B) Side views, rostral to the left, dorsal to the top; (C-D) dorsal to the top. 28 hpf. Scale bars: 400 μm in A; 200 μm in B; 100 μm in C-E. |

Expression of green fluorescent protein (GFP) in Tg(myf5(80K):GFP) transgenics matches the dynamic pattern of endogenous myf5 expression in cranial muscles. (A-D) GFP fluorescence is apparent in pectoral fin muscle (pm), dorsal rostral muscle (drm), and hypaxial muscle (hy). (C-E) GFP fluorescence is detected in the occipital somite (os; precursors of sternohyoideus, sh) and some cranial muscles, such as the superior oblique (so) and inferior oblique (io). (F-H) Endogenous myf5 transcripts are also detected in cranial muscles, including so and io by whole-mount mRNA in situ hybridization. (A,C,F) Side views, rostral to the left, dorsal to the top; (B,D,G) dorsal views, rostral to the left; (E,H) ventral views, rostral to the left. Scale bars: 200 μm. EXPRESSION / LABELING:
|

Green fluorescent protein (GFP) persists in cranial muscles of Tg(myf5(80k):GFP) transgenics. (A,B) GFP fluorescence is apparent in adductor hyomandibulae (ah), adductor mandibulae (am), adductor operculi (ao), constrictor hyoideus ventralis (chv), dilatator operculi (do), inferior oblique (io), lateral rectus (lr), medial rectus (mr), sternohyoideus (sh), superior oblique (so), and transverse ventralis (tv1?5) at 60 hours postfertilization (hpf). (C, D) Endogenous myf5 transcripts and (F, G) GFP mRNA are restricted to four spots by 60 hpf using whole-mount mRNA in situ hybridization. (E) At 60 hpf, myod transcripts are detected in most if not all cranial muscles. (A,C,E,F) Side views, rostral to the left, dorsal to the top; (B,D,G) ventral view, rostral to the left. Scale bars: 200 μm in all panels. EXPRESSION / LABELING:
|
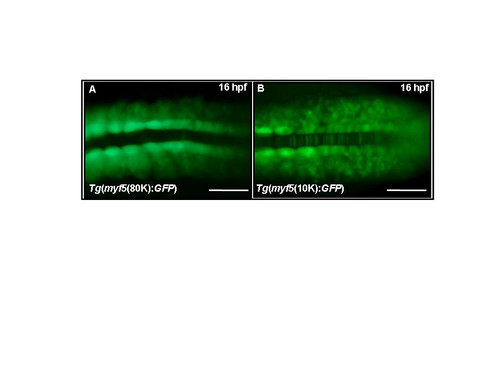
A proximal element regulates myf5 expression in the presomitic mesoderm. Green fluorescent protein (GFP) fluorescence is detected in the presomitic and somitic mesoderm of transgenic embryos harboring (A) -80 kb, Tg(myf5(80K):GFP) or (B) -10 kb, Tg(myf5(10K):GFP). Tg(myf5(10K):GFP) embryos also express GFP in the notochord. Dorsal views, rostral to the left. Scale bars: 200 μm. |

The myf5 upstream region contains modules that repress expression in notochord. Green fluorescent protein (GFP) fluorescence is detected in the notochord of transgenic embryos harboring (A) -10 kb, Tg(myf5(10K):GFP), (B) -6 kb, Tg(myf5(6K):GFP), or (C-D) -3 kb, Tg(myf5(3K):GFP). Side views, rostral to the left. Scale bars: 400 μm in A; 200 μm in B, C, D. |

The myf5 upstream region contains modules that regulate expression in spinal cord, bones, eyes and olfactory-pits. (A,B) Green fluorescent protein (GFP) fluorescence at 48 hours postfertilization (hpf) (A) and 72 hpf (B); the star in A indicates the location of hindbrain. (C,D) Cross-sections along the plane indicated by lines C and D in B, GFP signals are apparent in spinal cord (sc) and surface ectoderm. (E-J) GFP expression is observed in bones at 21 dpf (E and F), in bones at 60 dpf (G and H) in eyes (H and I), and olfactory pits (J). (K) The same embryo as (J) with brightfield illumination. am, adductor mandibulae; bh, basihyal; mc, Meckel's cartilage; n, notochord; op, olfactory pits; pq, palatoquadrate; sc, spinal cord. (A,B,E,H) Lateral views, rostral to the left, dorsal to the top; (F,G) ventral views, rostral to the left; (I-K) frontal views, dorsal to the top. Scare bars: 500 μm in A, E-H; 250 μm in I; 200 μm in B; 100 μm in C, D, J, K. |