
|
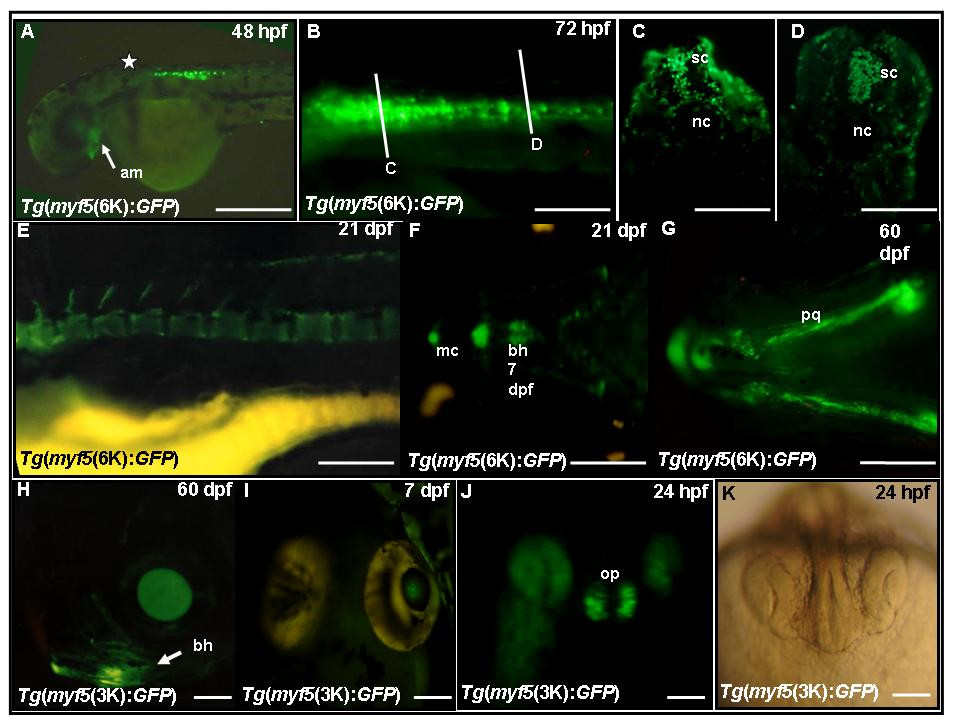
Fig. 8 The myf5 upstream region contains modules that regulate expression in spinal cord, bones, eyes and olfactory-pits. (A,B) Green fluorescent protein (GFP) fluorescence at 48 hours postfertilization (hpf) (A) and 72 hpf (B); the star in A indicates the location of hindbrain. (C,D) Cross-sections along the plane indicated by lines C and D in B, GFP signals are apparent in spinal cord (sc) and surface ectoderm. (E-J) GFP expression is observed in bones at 21 dpf (E and F), in bones at 60 dpf (G and H) in eyes (H and I), and olfactory pits (J). (K) The same embryo as (J) with brightfield illumination. am, adductor mandibulae; bh, basihyal; mc, Meckel's cartilage; n, notochord; op, olfactory pits; pq, palatoquadrate; sc, spinal cord. (A,B,E,H) Lateral views, rostral to the left, dorsal to the top; (F,G) ventral views, rostral to the left; (I-K) frontal views, dorsal to the top. Scare bars: 500 μm in A, E-H; 250 μm in I; 200 μm in B; 100 μm in C, D, J, K.