
- Title
-
Novel binding partners of Ldb1 are required for haematopoietic development
- Authors
- Meier, N., Krpic, S., Rodriguez, P., Strouboulis, J., Monti, M., Krijgsveld, J., Gering, M., Patient, R., Hostert, A., and Grosveld, F.
- Source
- Full text @ Development
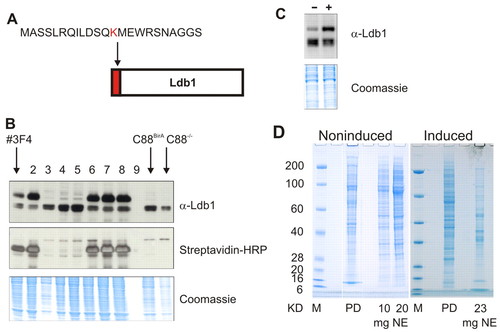
Ldb1 biotinylation and streptavidin pulldown. (A) Schematic representation of bio-Ldb1. The 23 amino acid sequence recognised by BirA and a triple haemagglutinin tag are fused in tandem to the amino-terminal end of the ATG-less Ldb-cDNA. (B) Expression of Ldb1 and bio-Ldb1 in nuclear extracts of induced C88BirA/bio-Ldb1, C88-/BirA and C88-/- cells. Eight of 16 transfectants are shown. Three clones (lanes 3-5) did not express bio-Ldb1, lane 9 not loaded. Clone #3F4 was chosen for further experiments. Lanes on the right are C88-/BirA and C88-/- controls. (C) Ldb1 and bio-Ldb1 expression in equal amounts (see Coomassie stained gel) of nuclear extracts of noninduced (-) and induced (+) #3F4 cells. Expression of endogenous Ldb1 is reduced in induced cells. (D) PAGE of proteins bound to bio-Ldb1. Pulldowns of noninduced and induced cell extracts washed at lower stringency conditions are shown. PD, pulled down proteins; NE, untreated nuclear extract. |

Analysis of Ldb1 interacting protein complexes. Protein levels of Eto-2, Cdk9 and Lmo4 change with induction of C88 cell differentiation. Western blot analysis of noninduced (Unind.) and induced (Ind.) C88 cells containing bio-Ldb1 (A) or untransfected C88 cell nuclear extracts (B). Input lanes indicate levels of tested proteins in untreated nuclear extracts diluted to the same concentration as in the immunoprecipitation experiments. Proteins immunoprecipitating with Ldb1 (IP lane) and supernatant (Sup) are shown and labelled accordingly. The isoforms of bio-Ldb1, Cdk9 and E2A, are indicated. |
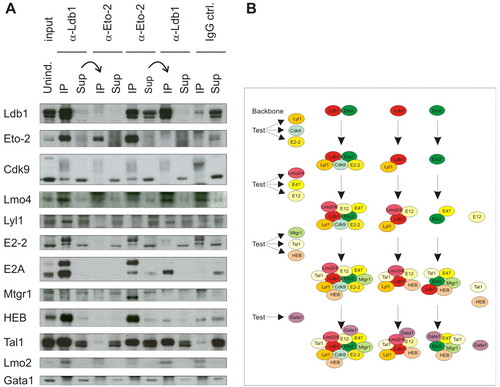
Sequential immunoprecipitations to investigate Ldb1- and Eto-2-containing complexes. (A) Nuclear extracts of noninduced normal C88 cells were first depleted of either Ldb1 or Eto-2 with their respective antibodies. The supernatants were then incubated with α-Eto-2 or α-Ldb1, respectively. The second supernatant was also loaded to determine which proteins do not interact with either Eto-2 or Ldb1. IgG lanes are control immunoprecipitations carried out with a nonspecific, isotype-matched antibody. (B) Scheme of interacting factors from IP experiments in A (see also Fig. S1A in the supplementary material). Each new line represents the analysis of an additional three transcription factors. |
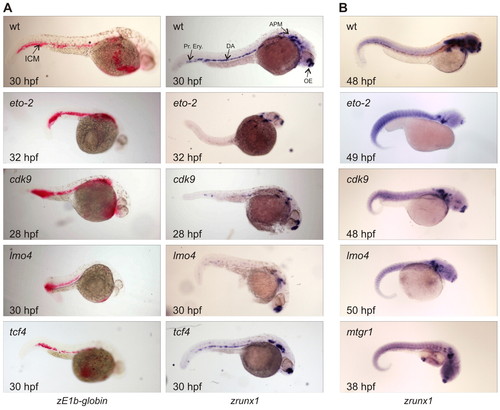
Analysis of zebrafish embryos after MO injections. The developmental stage of each embryo is in the bottom left corner; the targeted gene is indicated in the top left corner. All pictures were taken at the same magnification. (A) Noninjected wild-type (wt) control embryos stained for βE1- (zE1b-globin, left column) and runx1-mRNAs (right column). The ICM, dorsal aorta (DA), primitive erythrocytes (Pr.Ery.), anterior paraxial mesoderm (APM) and olfactory epithelium (OE) are indicated. The βE1signal is red, runx1 signal is blue. Treated embryos were injected with 1 pmol eto-2-MO (32 hpf), 1 pmol cdk9-MO (28 hpf), 1 pmol lmo4-MO (30 hpf), or with 0.5 pmol of the control tcf4-MO (30 hpf). (B) The reduction of runx1 expression in the dorsal aorta region resulting from injection with the MOs directed against eto-2 (n=23/27), cdk9 (n=33/56) and lmo4 (n=36/54) was still observable after 2 days. Embryos injected with the mtgr1-MO were analysed at 38 hpf and showed only a slight effect on the definitive haematopoietic system. All embryos shown were injected with 1 pmol of the corresponding MO. |
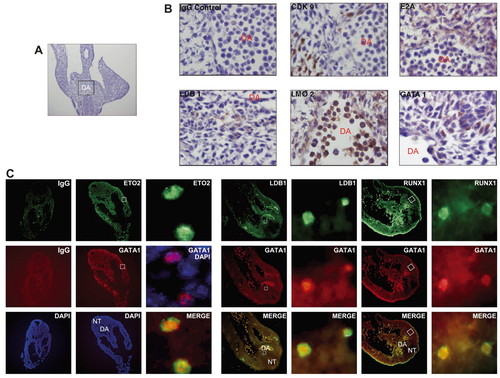
Ldb1 interacting partners are expressed in the P-Sp. (A) Haematoxylin stained 10 μm transversal cryosection of a E9.5 FvB embryo. The area of the P-Sp is indicated by the box. (B) High magnification (x1000) of the areas such as shown in (A). Expression of Cdk9, E2A, Ldb1, Lmo2 and Gata1 was detected with specific antibodies and visualised with DAB. IgG panel shows the background staining with an unspecific IgG antibody. (C) Immunofluorescence analysis of E9.5 embryos with α-Eto-2, α-Ldb1, α-Runx1 and α-Gata1 antibodies. Specific staining is seen for both Eto-2 (green) and Gata1 (red) antibodies (second column), compared with the IgG control (first column). (Third column) Enlargement of the section shown in the second column. Merge is a superposition of images of the Eto-2 and Gata1 detection; cells that express both Eto-2 and Gata1 appear as yellow. The overlay of Gata1 and DAPI staining shows exclusive nuclear localisation of Gata1, whereas Eto-2 is seen in the nucleus and cytoplasm. (Fourth column) Ldb1- (green) and Gata1- (red) expressing cells are located in the dorsal aorta region; most of the cells positive for Ldb1 are also positive for Gata1 (Ldb1 is also expressed in other cell types). A similar pattern is shown for Gata1- (red) and Runx1- (green) expressing cells in E9.5 embryos (sixth column). (Fifth and seventh columns) High magnification of the same sections reveals more detail. DA, dorsal aorta; NT, neural tube. |

Sequential immunoprecipitations using nuclear extracts of bio-Ldb1 cells. (A) Sequential immunoprecipitations as shown in Fig. 3 using nuclear extracts from uninduced bio-Ldb1 MEL cells (clone #3F4). (B) Nuclear extracts from uninduced and induced #3F4 cells were subjected to sequential IPs as shown in Fig. 3 and tested for co-immunoprecipitation with α-Hdac1. |
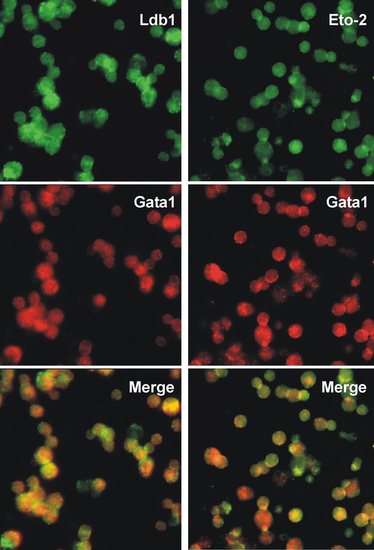
Immunocytochemistry of E12 fetal liver cells showing nuclear co-localisation of Ldb1 or Eto2 with Gata1. Methods as described for Fig. 6. |