
|
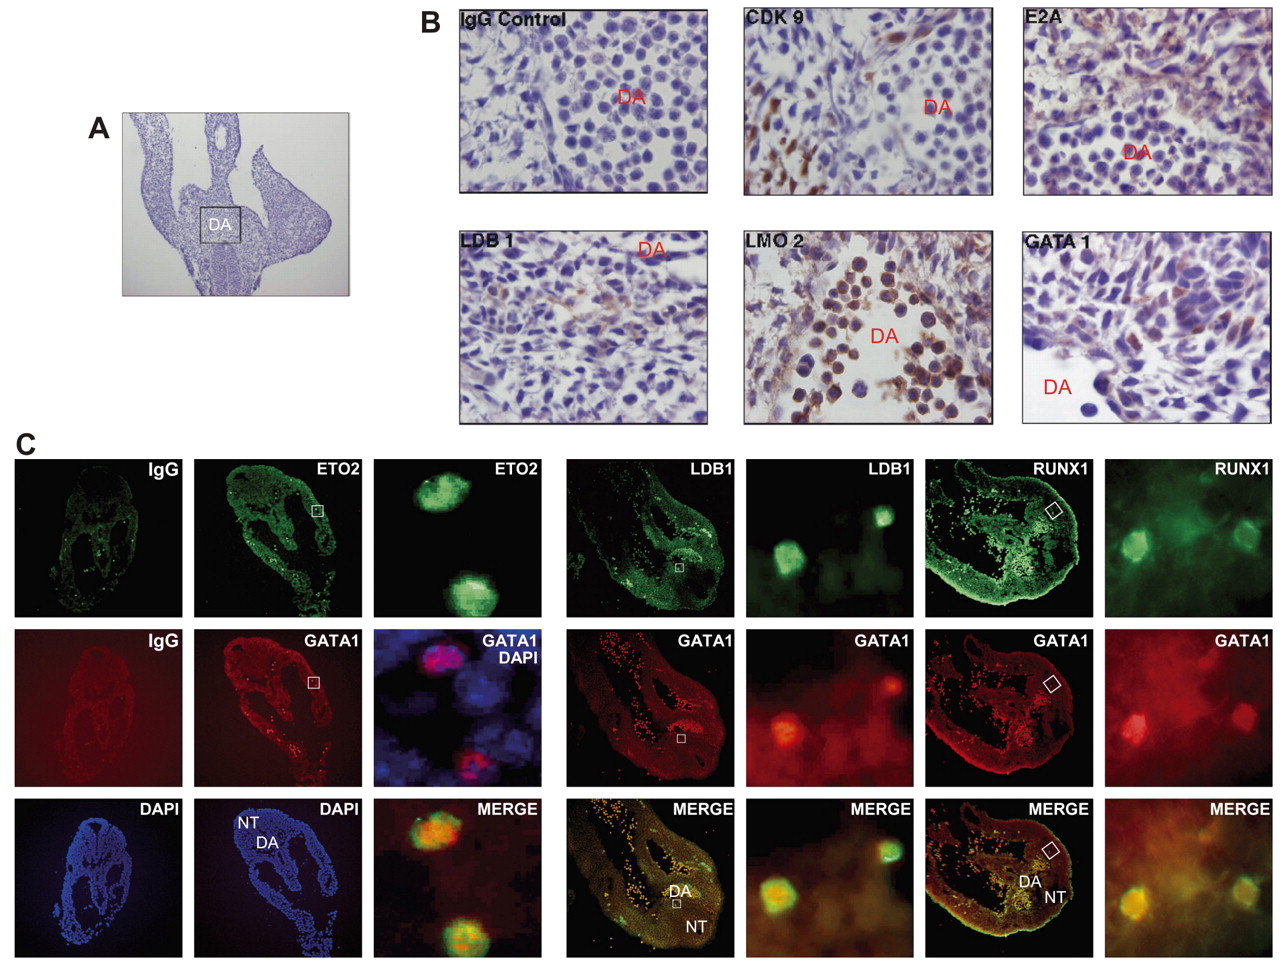
Fig. 6 Ldb1 interacting partners are expressed in the P-Sp. (A) Haematoxylin stained 10 μm transversal cryosection of a E9.5 FvB embryo. The area of the P-Sp is indicated by the box. (B) High magnification (x1000) of the areas such as shown in (A). Expression of Cdk9, E2A, Ldb1, Lmo2 and Gata1 was detected with specific antibodies and visualised with DAB. IgG panel shows the background staining with an unspecific IgG antibody. (C) Immunofluorescence analysis of E9.5 embryos with α-Eto-2, α-Ldb1, α-Runx1 and α-Gata1 antibodies. Specific staining is seen for both Eto-2 (green) and Gata1 (red) antibodies (second column), compared with the IgG control (first column). (Third column) Enlargement of the section shown in the second column. Merge is a superposition of images of the Eto-2 and Gata1 detection; cells that express both Eto-2 and Gata1 appear as yellow. The overlay of Gata1 and DAPI staining shows exclusive nuclear localisation of Gata1, whereas Eto-2 is seen in the nucleus and cytoplasm. (Fourth column) Ldb1- (green) and Gata1- (red) expressing cells are located in the dorsal aorta region; most of the cells positive for Ldb1 are also positive for Gata1 (Ldb1 is also expressed in other cell types). A similar pattern is shown for Gata1- (red) and Runx1- (green) expressing cells in E9.5 embryos (sixth column). (Fifth and seventh columns) High magnification of the same sections reveals more detail. DA, dorsal aorta; NT, neural tube.