
|
Figure 1
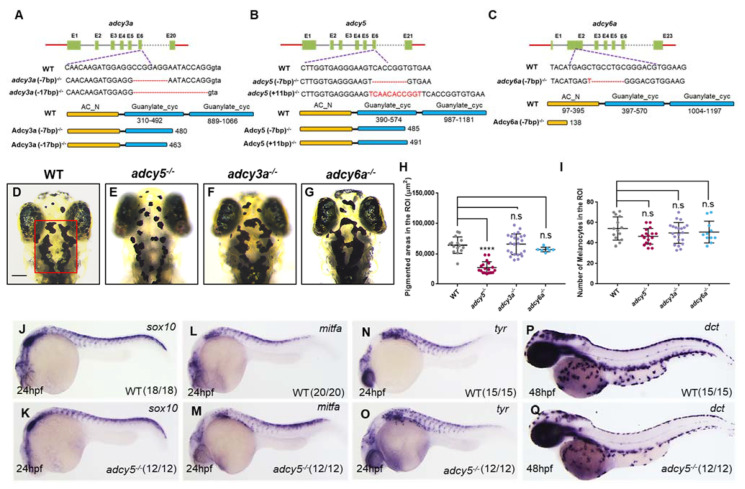
adcy5 mutation affects melanosome dispersion during embryonic stages. (A–C) The sgRNA target is designed in the sixth exon of adcy3a (A) and adcy5 (B), and the second exon of adcy6a (C). Schematic representations of the nucleotide sequences show a 7-bp and a 17-bp deletion in adcy3a-/- (A), a 7-bp deletion and an 11-bp insertion in adcy5-/- (B), and a 7-bp deletion in adcy6a-/- (C). Red dashes indicate the deleted bases; the inserted bases are marked in red. Predicted domain structure of Adcy3a, Adcy5, and Adcy6a from wild-type and mutant amino acid sequences. (D–G) adcy3a-/- (F) and adcy6a-/- (G) single mutants show normal melanosome dispersion as seen in WT embryos (D) under dark conditions at 4dpf, whereas adcy5-/- single mutants (E) exhibit aggregated melanosomes. The red box in (D) indicates a defined region of interest (ROI) to quantify pigmentation coverage and melanocyte numbers. The ROI was restricted to the range from the middle of the eyes to the posterior of the hindbrain. Scale bar = 100 μm in (D–G). (H) Pigmentation coverage in the ROI is significantly decreased in adcy5-/- mutants compared to WT embryos (Student’s t-test, **** p < 0.0001, n.s., not significant, p > 0.05). (I) Statistical analyses show that the number of melanocytes in adcy3a-/-, adcy5-/-, and adcy6a-/- is comparable with that of WT embryos (Student’s t-test, n.s., not significant, p > 0.05). (J–Q) WISH analyses show the expression levels of sox10, mitfa, tyr, and dct in adcy5-/- mutants are comparable with those in WT embryos.