
FIGURE 2
|
FIGURE 2
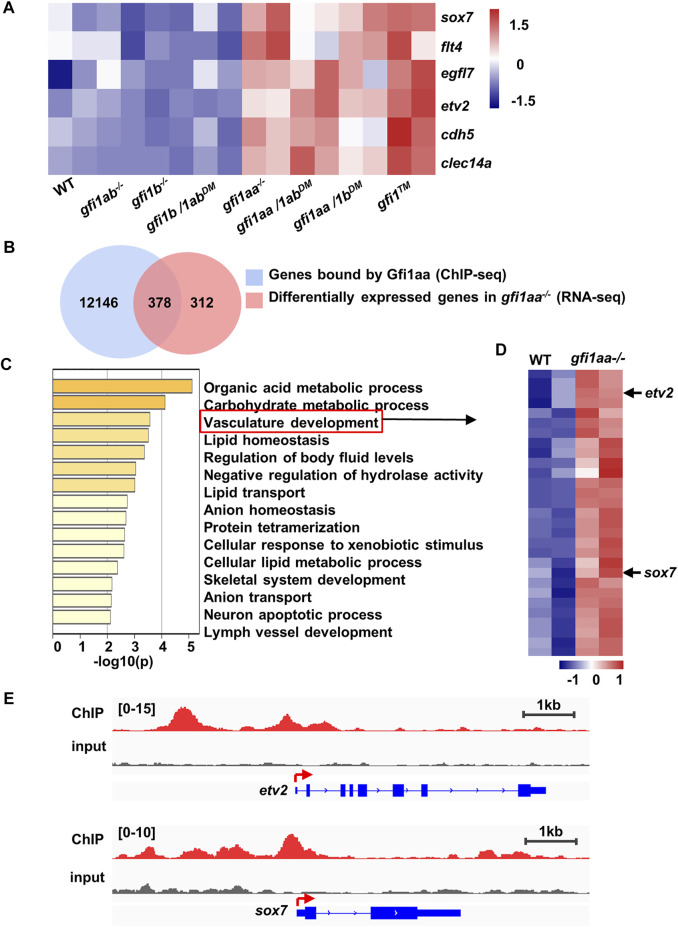
Gfi1aa could bind to etv2 and sox7 regulator regions (A) Endothelial genes were increased in gfi1aa related mutants. Heatmap of WT, gfi1aa −/− , gfi1b −/− , gfi1ab −/− signal mutant, gfi1aa/1b DM , gfi1aa/1ab DM , gfi1b/1ab DM double mutant and gfi1 TM triple mutant showed the gene expression levels of endothelial genes (sox7, flt4, cdh5, clec14a, etv2, and egfl7). The color scale indicated the expression level (B) Combinational analysis of gfi1aa −/− RNA-seq and Gfi1aa-eGFP ChIP-seq. 378 genes were overlapped between 690 up-regulated genes in gfi1aa −/− mutant and 12,524 genes bound by Gfi1aa (C) Go enrichment analysis of the 378 combinational genes. Vasculature development GO term was indicated by the red box (D) Heat map of WT and gfi1aa −/− mutant showed the vasculature development genes expression levels from (C). The color scale indicated the expression level (E) Visualization of Gfi1aa binding sites on etv2 (top) and sox7 (bottom) indicated by Gfi1aa ChIP-seq (red) compared to input control (grey) through integrative genomics viewer (IGV).