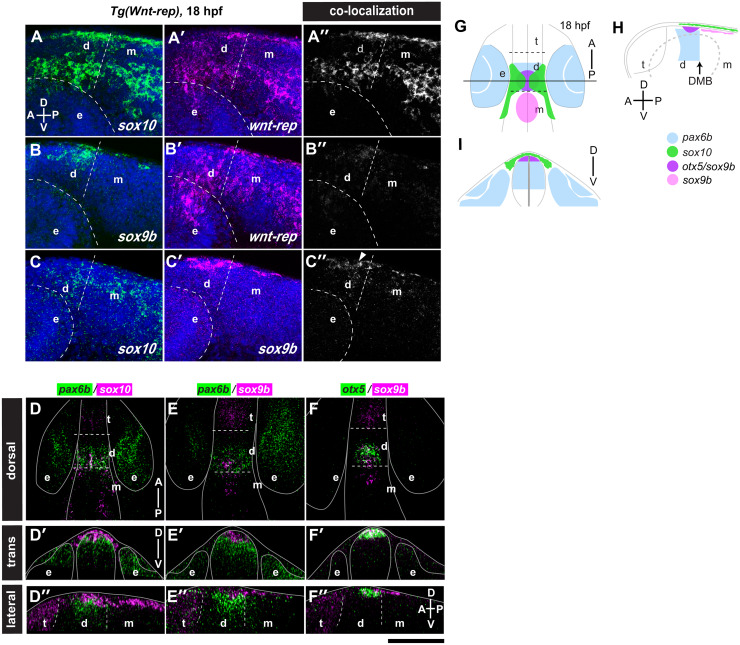
IMAGE

Fig 4

ID
ZDB-IMAGE-200711-27
Genes
Source
Figures for Takamiya et al., 2020
Image
Figure Caption

Fig 4 2°NC cells arise from the dorsal diencephalon and mesencephalon.

(A-C”) Double in situ hybridisation analysis in the diencephalon of Tg(Wnt-rep) transgenic embryos at 18 hpf (lateral view, anterior left, dorsal up). Three combinations of probes were examined: sox10/wnt-rep (A, A’), sox9b/wnt-rep (B, B’) and sox10/sox9b (C, C’). Panels A”-C” show co-localization of two probes as white region. Embryos were counterstained with DAPI to visualize nuclei (blue). Marginal co-localization of sox9b and sox10 transcripts is indicated by an arrowhead (C”). (D-F”) Pairwise comparisons of the expression patterns of pax6b/sox10 (D-D”), pax6b/sox9b (E-E”) and otx5/sox9b (F-F”) are summarised in dorsal maximum projection views (D-F), transverse sections at the level of the pineal anlage (D’-F’) and sagittal optical sections along the midline (D”-F”). At 18 hpf, pax6b and sox10 expression (D) as well as pax6b and sox9b (E), appear to overlap when fluorescent signals were projected in dorsal views. Expression is, however, mostly confined to distinct dorsoventral layers (D’-E”). (F-F”) sox9b co-localizes with otx5. (G-I) Summary of the gene expression pattern in dorsal view (G), in transverse view (I) along the horizontal line in G and in lateral view (H). The sox10-positive NC cells (green) reside next to sox9b- and otx5 double positive cells of the epiphysis anlage (purple). t: telencephalon; d: diencephalon; m: mesencephalon; e: eye; DMB: diencephalon midbrain boundary; Scale bar: A-C”: 100 μm; D-F”: 150 μm.

Figure Data
Acknowledgments
This image is the copyrighted work of the attributed author or publisher, and ZFIN has permission only to display this image to its users. Additional permissions should be obtained from the applicable author or publisher of the image. Full text @ PLoS Genet.