
Fig. 6
|
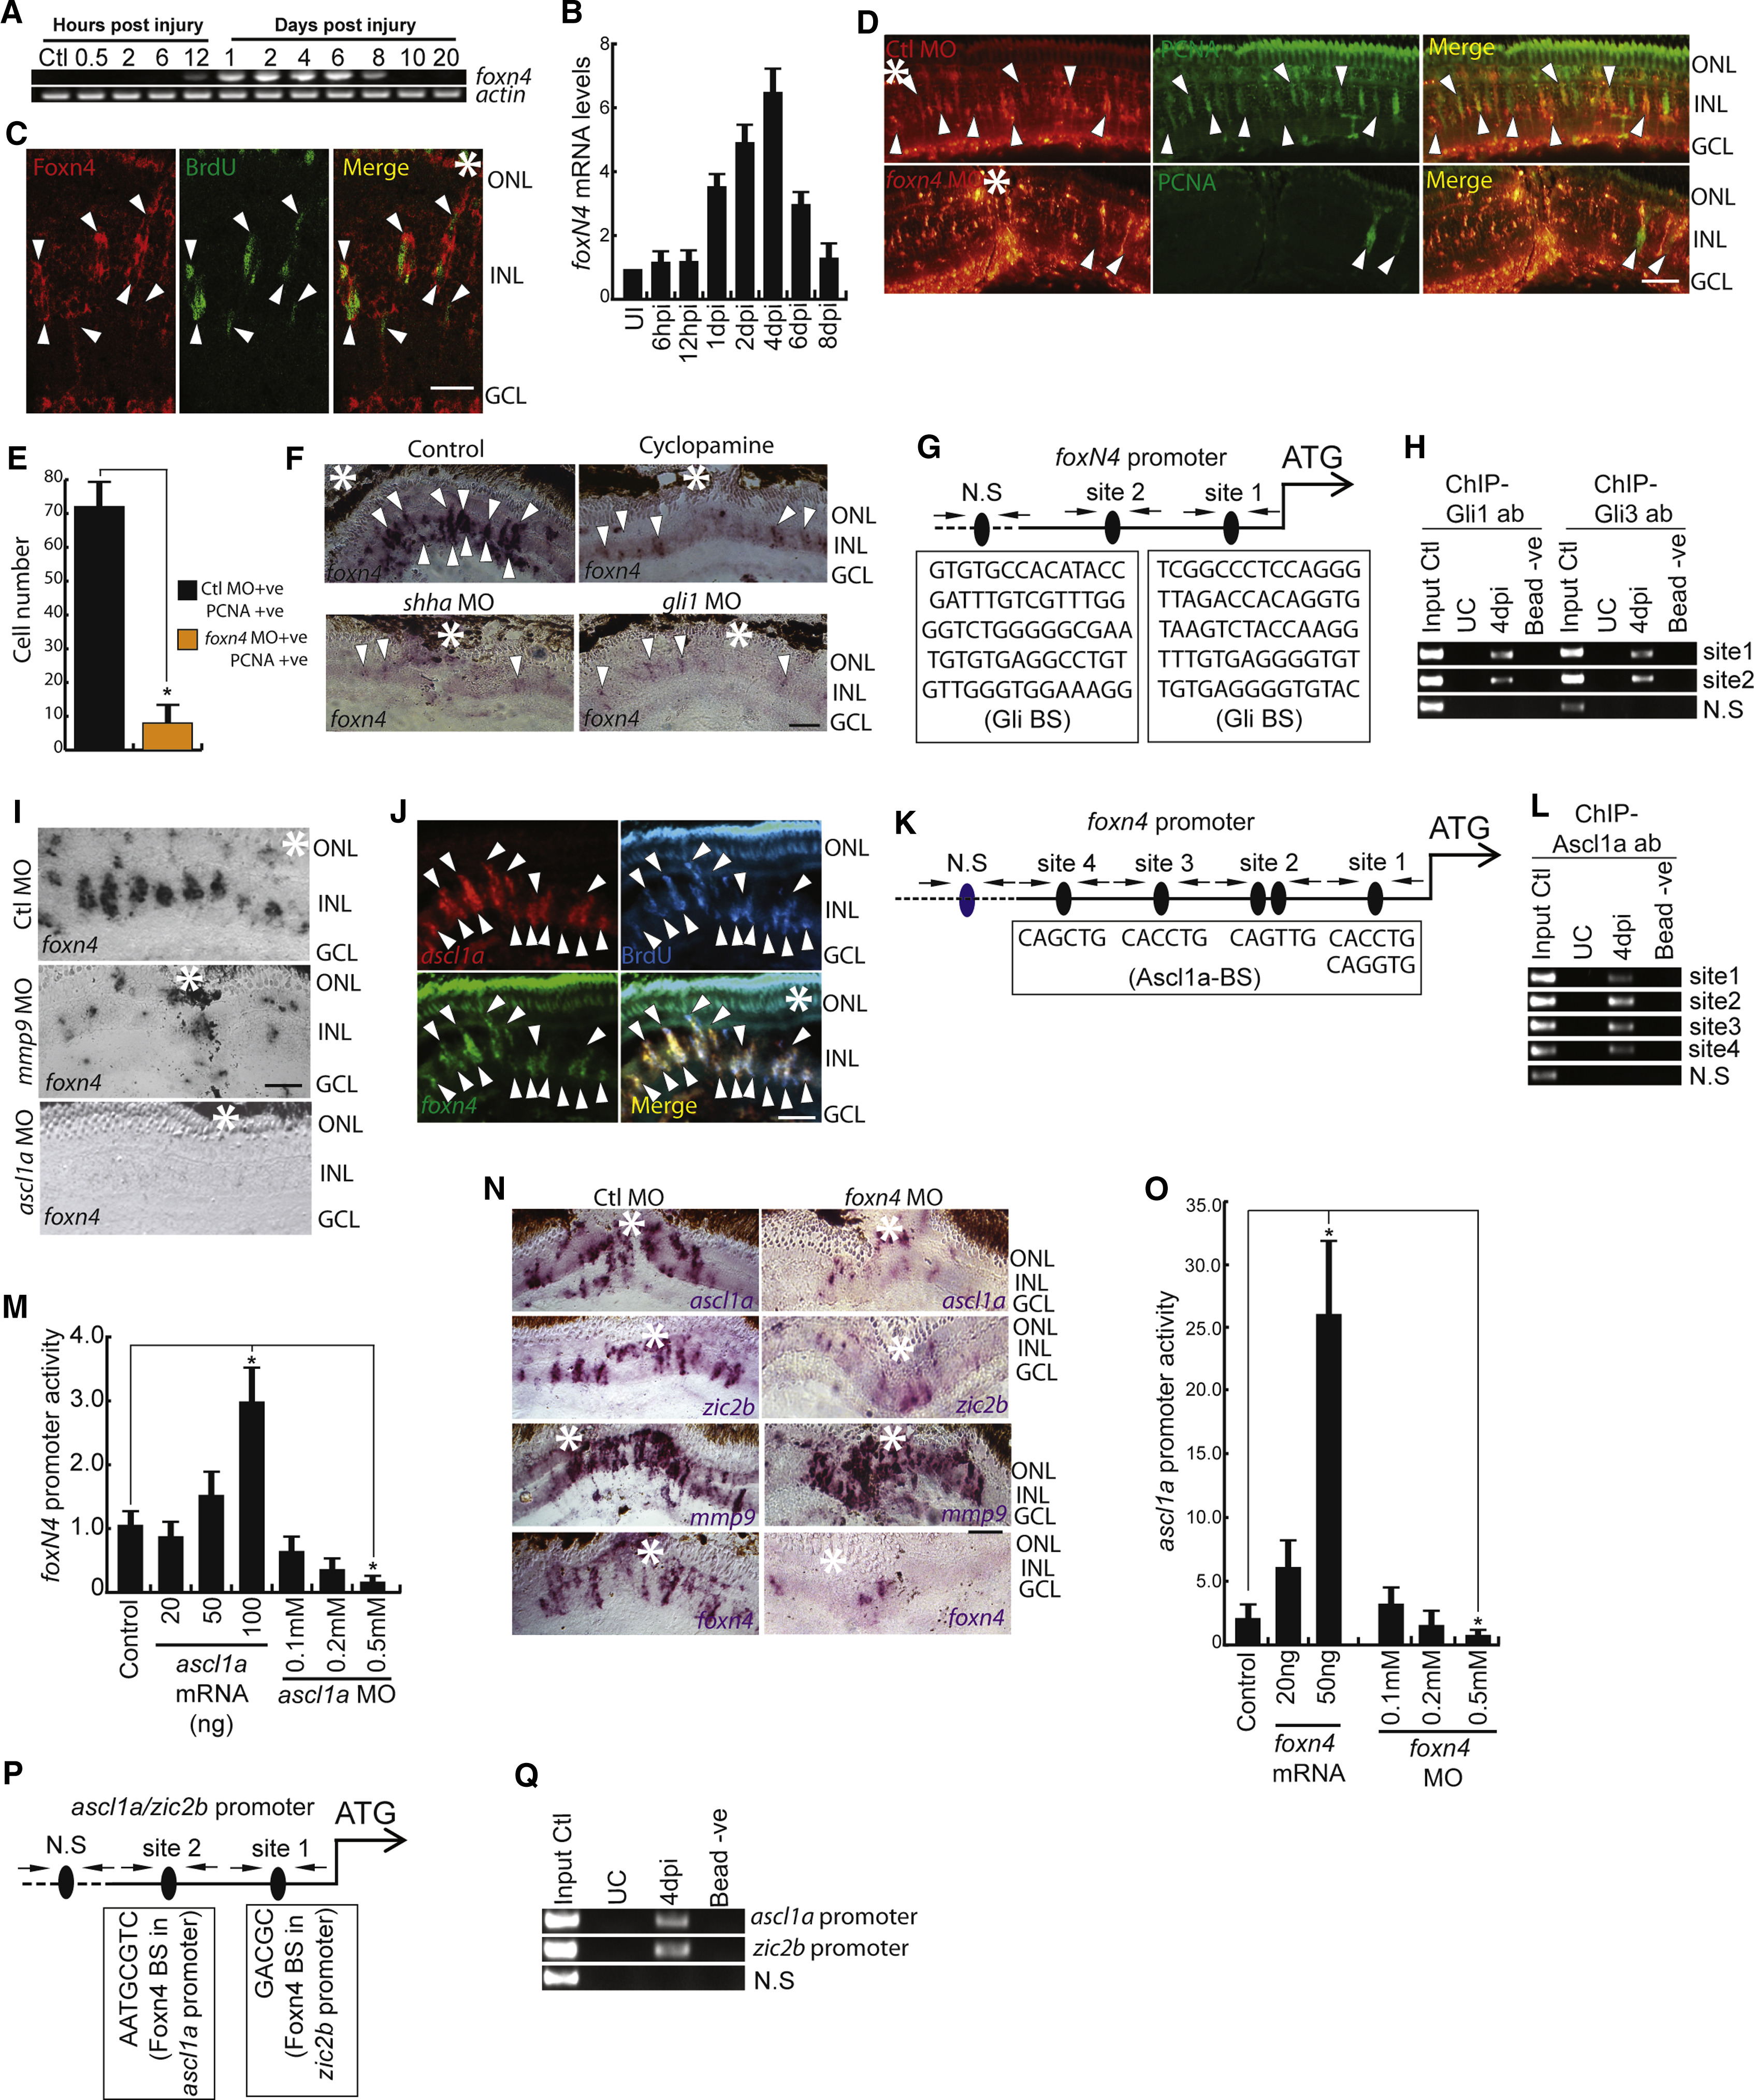
Fig. 6
Expression Dynamics and Necessity of Foxn4 during Regeneration
(A and B) RT-PCR (A) and qPCR (B) analysis of injury-dependent foxn4 expression in the retina; n = 6 biological replicates. (C) IF microscopy of a 0.5-μm-thick optical section of retina revealing co-localization of Foxn4 with BrdU+ MGPCs in 4 dpi retina.
(D and E) IF microscopy images of the retina with foxn4 knockdown at 4 dpi (D). The number of PCNA+ MGPCs is quantified in (E).
(F) BF microscopy images of foxn4 mRNA ISH in retinal sections with cyclopamine treatment and shha or gli1 knockdowns.
(G and H) Schematic of foxn4 promoter with a putative Gli-BS cluster, where arrows mark ChIP primers, N.S marks negative control, and capital letters mark putative Gli-BSs (G). A retinal ChIP assay at 4 dpi showing both Gli1 and Gli3 bound to the foxn4 promoter (H).
(I) BF microscopy images of foxn4 mRNA ISH in retinal sections with mmp9 or ascl1a knockdowns.
(J) FISH and IF microscopy images of a 0.5-μm-thick optical section of retina showing co-localization of foxn4 and ascl1a in BrdU+ MGPCs at 4 dpi. Arrowheads mark co-expression of genes in BrdU+ cells.
(K and L) Schematic of the foxn4 promoter with a putative Ascl1a-binding site cluster, where arrows mark ChIP primers, N.S marks negative control, and capital letters mark putative Ascl1a-BS (K). A retinal ChIP assay at 4 dpi showing Ascl1a bound to the foxn4 promoter (L).
(M) Luciferase assay showing foxn4 promoter activity with overexpression or knockdown of ascl1a in 24 hpf embryos.
(N) BF microscopy images of mRNA ISH in retinal sections with foxn4 knockdown showing levels of genes (namely, ascl1a, zic2b, mmp9, and foxn4) at 4 dpi.
(O) Luciferase assay showing ascl1a promoter activity with overexpression or knockdown of foxn4 in 24 hpf embryos.
(P and Q) Schematic of ascl1a and zic2b promoter with a putative Foxn4-binding site cluster, where arrows mark ChIP primers, N.S marks negative control, and capital letters mark putative Foxn4-BS (P). A retinal ChIP assay at 4 dpi showing Foxn4 bound to both the ascl1a and zic2b promoters (Q).
Scale bars represent 10 μm (C, D, F, I, J, and N). Error bars represent SD. ∗p < 0.001 (M); ∗p < 0.04 (O). Biological replicates n = 6 in (M) and O, and n = 3 in (B). Asterisk marks injury spots in (C),(D),(F), (J) and (N). See also Figures S5–S7.