
IMAGE
Fig. 3
Image
|
Figure Caption
Fig. 3
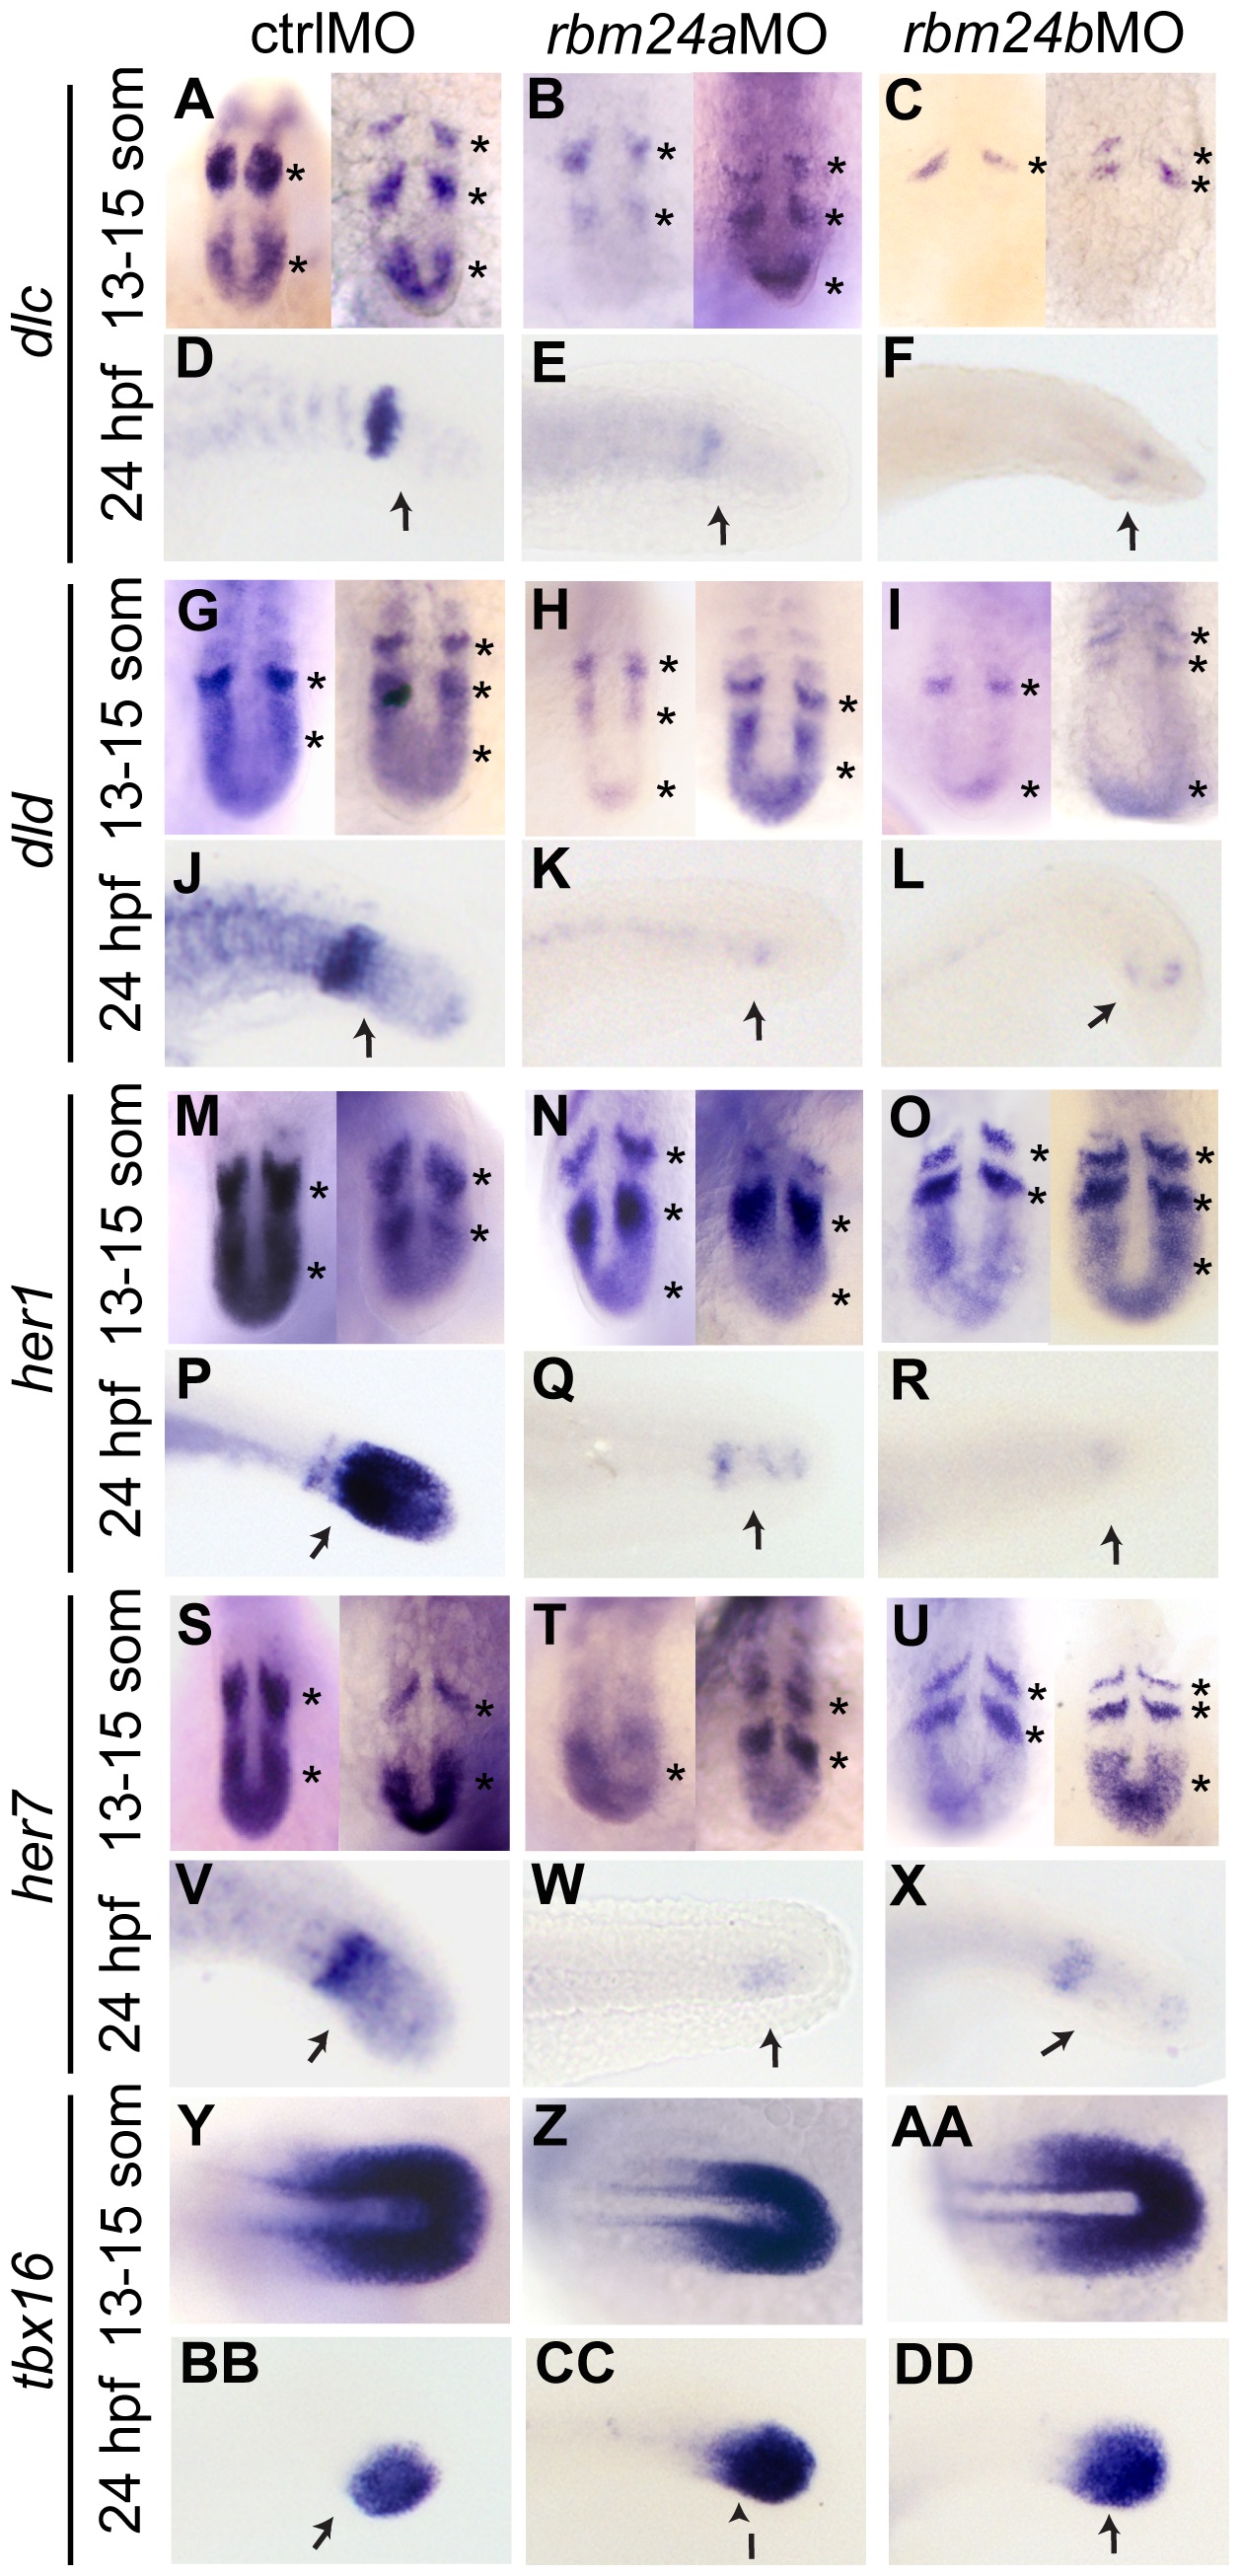
Notch-signaling pathway transcripts are depleted in somites of rbm24aMO and rbm24bMO embryos.
ISH images of the PSM of dorsally oriented 13-15 somite and laterally oriented 24 hpf ctrlMO, rbm24aMO and rbm24bMO embryos. 13-15 somite embryos are shown in 2 different temporal stages of development. Spatial expression of dlc (A-F), dld (G-L), her1 (M-R) and her7 (S-X) and tbx16 (Y-DD). Asterisks highlight cycling expression. n = 8-12 embryos stained per time-point with no more than 1 deviating from the displayed expression. arrow, regions of interest for PSM expression.
Figure Data
Acknowledgments
This image is the copyrighted work of the attributed author or publisher, and
ZFIN has permission only to display this image to its users.
Additional permissions should be obtained from the applicable author or publisher of the image.
Full text @ PLoS One