
Fig. S1
|
Fig. S1
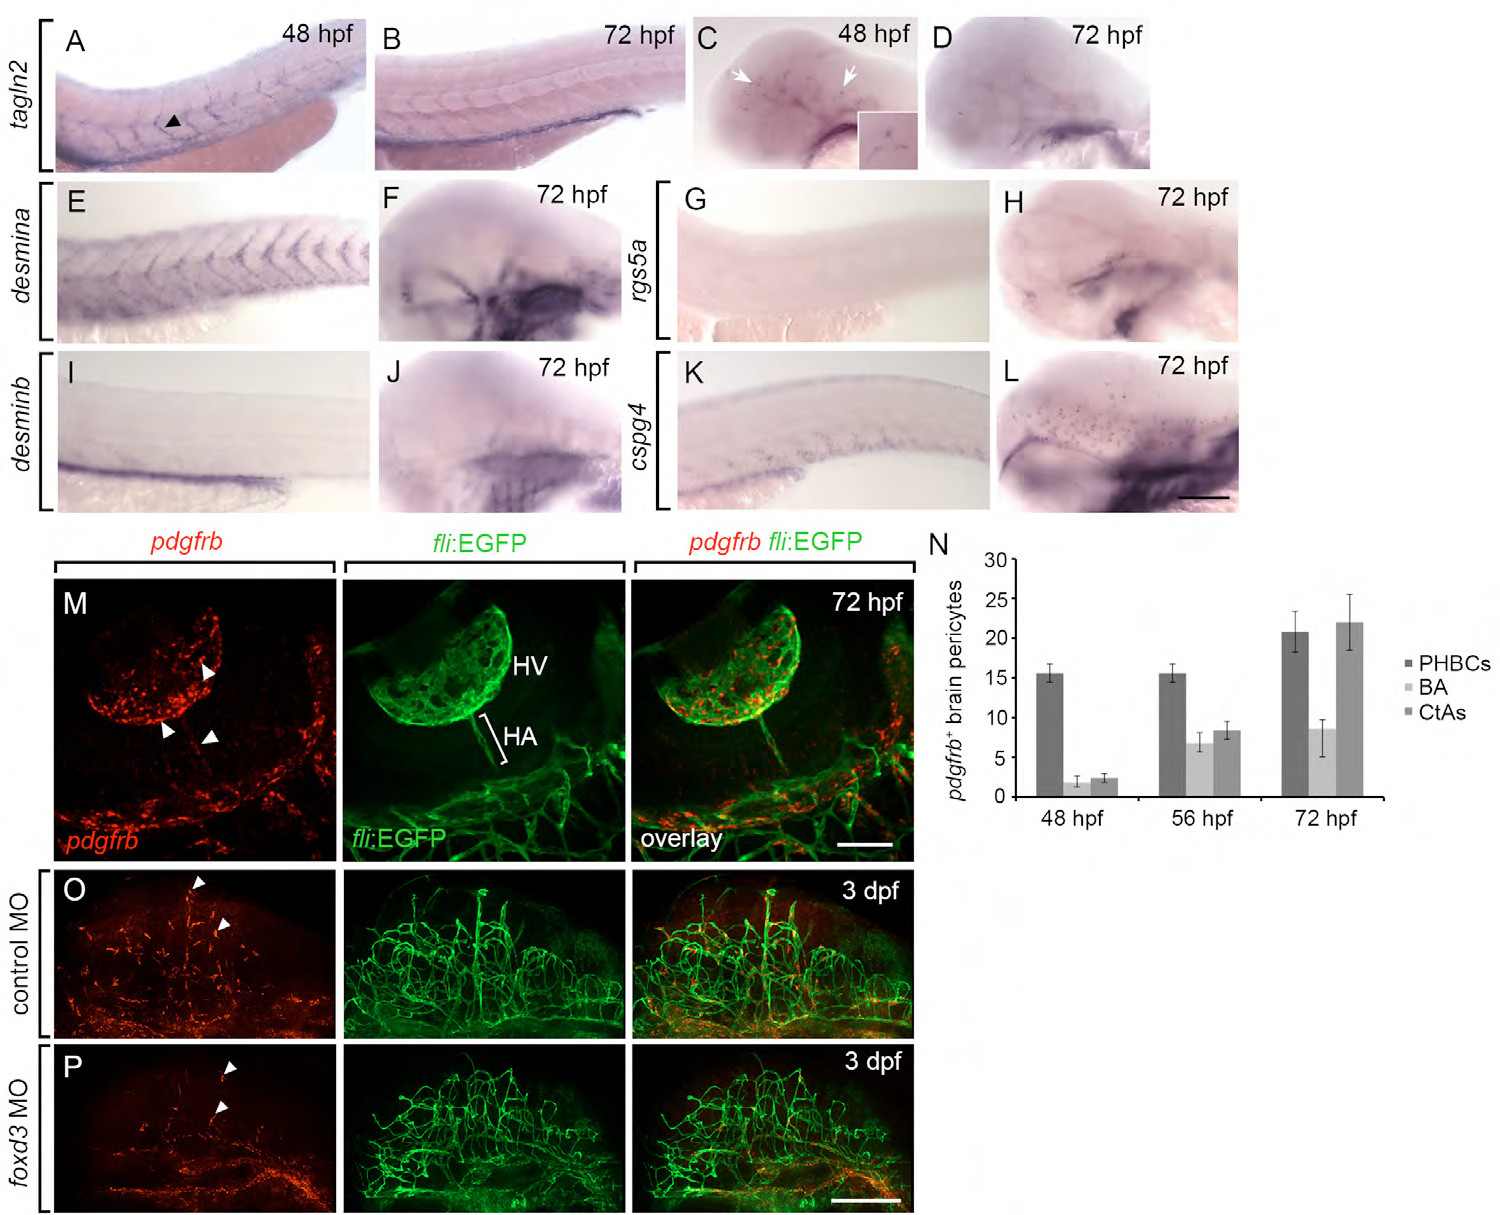
Expression patterns of tagln2 and pdgfrb in zebrafish embryos and larvae. (A-C) ISH for tagln2. (A,B) tagln2 expression in trunk vessels at 48 hpf and 72 hpf, respectively. Arrowhead, tagln2+ putative mural cell in ISV. (C,D) tagln2 expression in brain vasculature at 48 hpf and 72 hpf. Arrow, tagln2+ putative brain mural cell. Inset, high magnification view of tagln2+ cells in the brain. (E-L) desmina, desminb, rgs5a, and cspg4 expression in trunk and brain vasculature at 72 hpf. (E,G,I,K) trunk expression. (F,H,J,L) brain expression. (M) Fluorescent ISH showing pdgfrb expression in retinal pericytes at 72 hpf. Arrowheads, pdgfrb+ retinal pericytes. (N) Quantification of pdgfrb+ pericytes associated with different hindbrain vessels at various time points. (O,P) foxd3 MO knockdown caused reduction in pdgfrb+ brain pericyte number. (O) Control MO-injected 72 hpf larva. (P) foxd3 MO-injected 72 hpf larva. Arrowheads, pdgfrb+ brain pericytes. HA, hyaloid artery; HV, hyaloid vessels. Scale bars: (A-L) 0.5 mm, (M-P) 200 μm.