
Image
|
Figure Caption
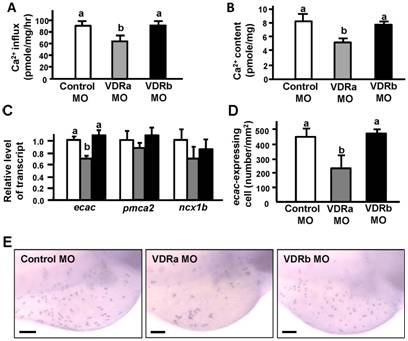
Fig. 5 Effects of vitamin D receptor (VDR)a and VDRb morpholino oligonucleotides (MOs) in 3-d post-fertilization (dpf) zebrafish embryos.
Ca2+ influx (A), Ca2+ content (B), mRNA expression (C), density of ecac-expressing cells (D), and ecac signals (E). mRNA expressions were analyzed by a qPCR using β-actin as the internal control. Different letters indicate a significant difference (p<0.05) using a one-way ANOVA followed by Tukey’s multiple-comparison test. Values are the mean ± SD (n = 6 or 7). Scale bar:100 μm.
Figure Data
Acknowledgments
This image is the copyrighted work of the attributed author or publisher, and
ZFIN has permission only to display this image to its users.
Additional permissions should be obtained from the applicable author or publisher of the image.
Full text @ PLoS One