
|
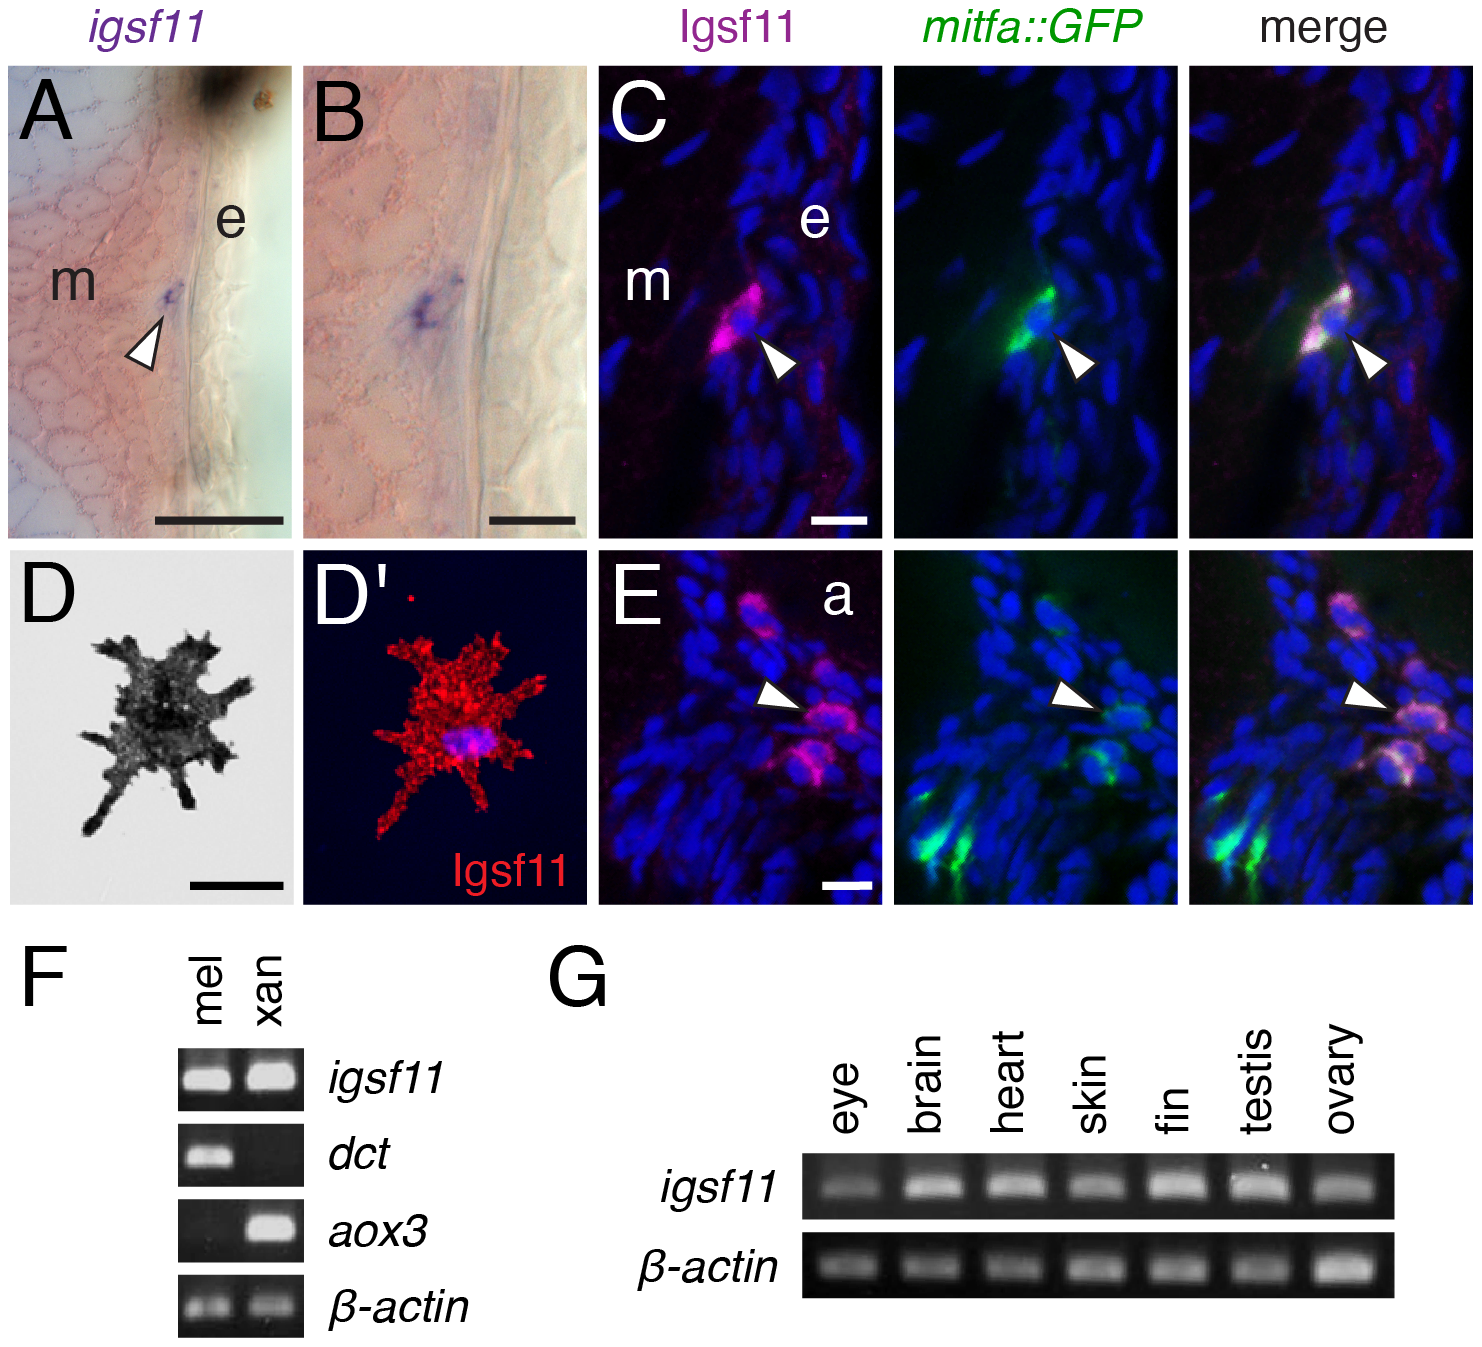
Fig. 5
igsf11 is expressed by pigment cells and their precursors.
(A,B) In situ hybridization for igsf11 transcript during the larval-to-adult transformation, showing an igfs11-expressing cell near the hypodermis (A, and higher magnification in B). e, epidermis; m, myotome. (C) Similar location to that shown in (B), illustrating a cell within the hypodermis (arrowhead), coexpressing Igsf11 cell (magenta) and mitfa:GFP (green). Nuclei in all immunofluorescence images are counterstained with DAPI (blue). (D,D2) A melanophore isolated in vitro expresses Igsf11 (red). (E). Extra-hypodermal Igsf11+ cells (arrowhead) also coexpressed Igsf11 (magenta) and mitfa:GFP, though some mitfa:GFP+ cells were Igsf11 (lower left of panels). Shown here are cells just ventral to the aorta (a). (F) RT-PCR showed that cell populations isolated by differential centrifugation and highly enriched for melanophores (mel) and xanthophores (xan) express igsf11 transcript. dct, dopachrome tautomerase, expressed by melanophores; aox3, aldehyde oxidase 3, expressed by xanthophores. β-actin, loading control. (G) igsf11 expression was detected in several additional tissue types dissected from adult fish. Scale bars: in (A) 40 μm for (A); in (B) 10 μm for (B); in (C) 10 μm for (C,E); in (D) 20 μm for (D).