
Image
|
Figure Caption
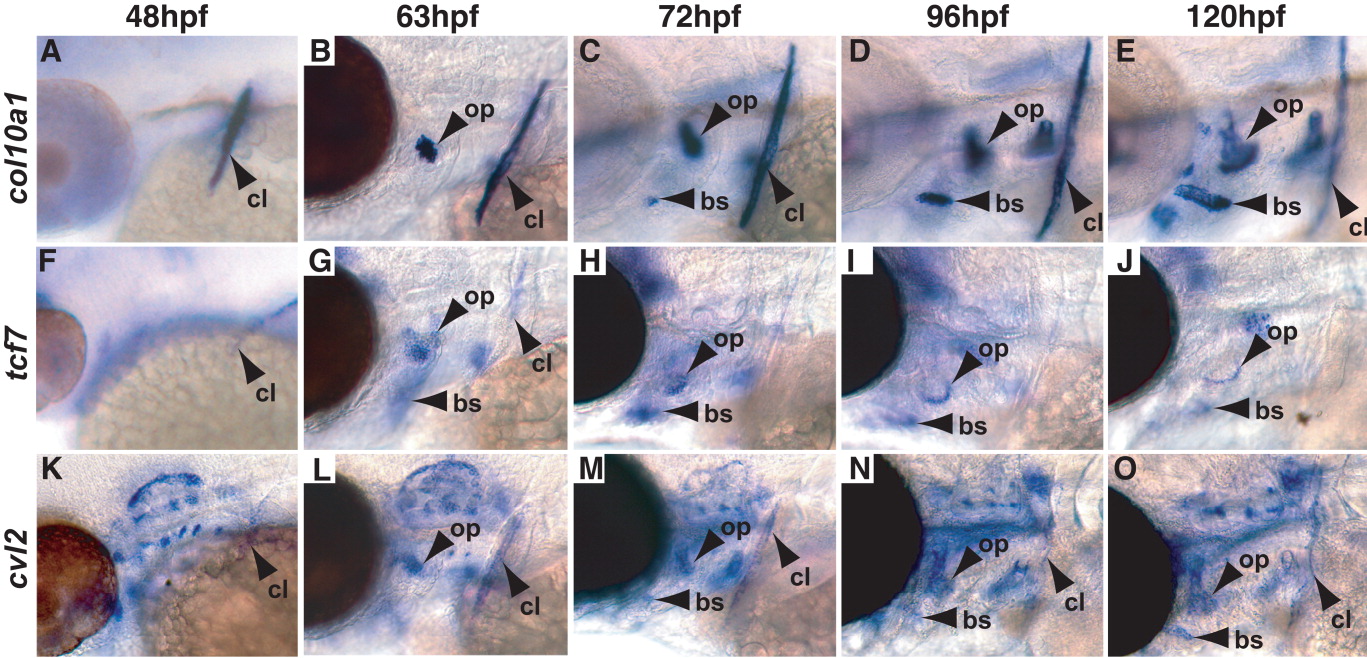
Fig. 3 Atypical osteoblast gene expression: side views. Five stages shown as described in Figure 1. See Figure 1 for abbreviations and scale bar. A high resolution image of this figure is available online.
Figure Data
Acknowledgments
This image is the copyrighted work of the attributed author or publisher, and
ZFIN has permission only to display this image to its users.
Additional permissions should be obtained from the applicable author or publisher of the image.
Full text @ Dev. Dyn.