
Fig. 6
|
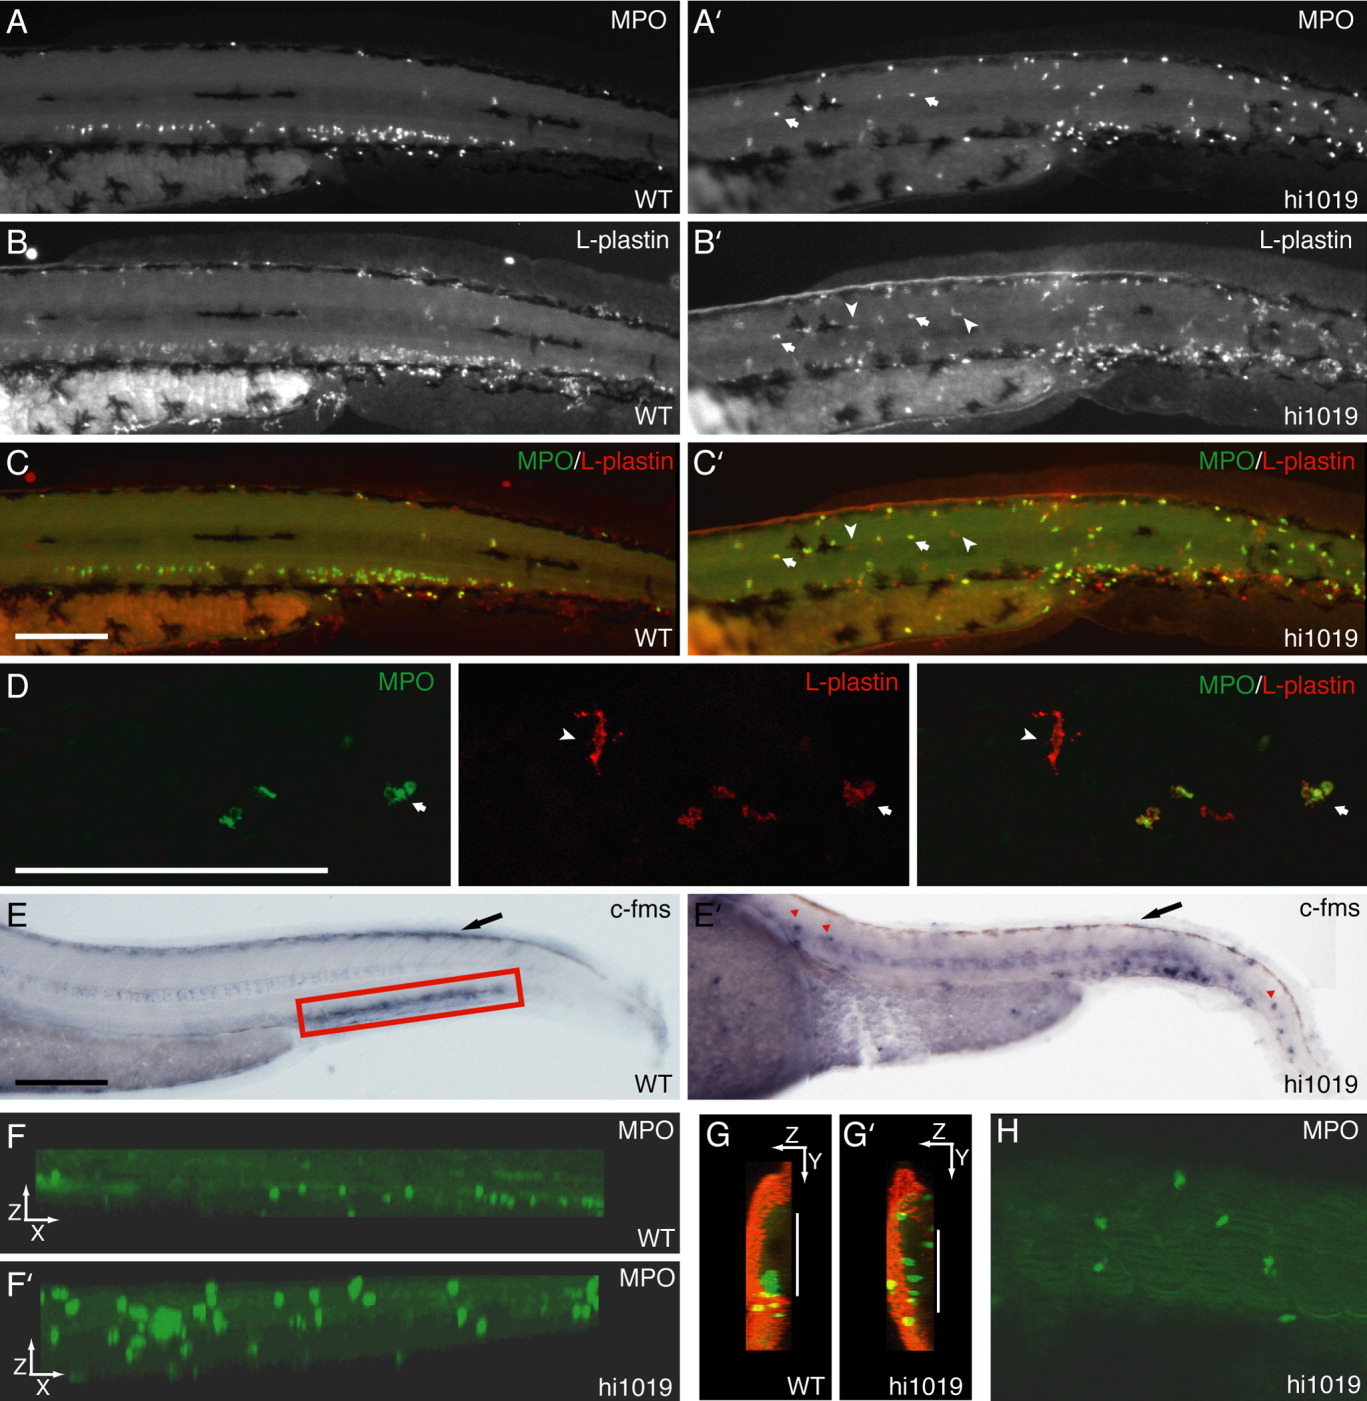
Fig. 6 Leukocyte recruitment into the body of fad24hi1019 mutants. A-C: WT larvae. A′-C′: fad24hi1019 mutant larvae. Immunolabeling for MPO (A,A′) and L-plastin (B,B′). C,C′: Overlay of MPO and L-plastin co-immunolabeling shows that neutrophils, MPO+ and L-plastin+ (arrows), and macrophages, L-plastin+ and MPO- cells (arrowhead), contribute to the inflammatory response. D: Confocal projections show the more elongated morphology of macrophages (arrowhead) compared to neutrophils (arrow). E,E′: Whole-mount in situ hybridization for c-fms, a macrophage marker. Red box, CHT; red arrows, macrophages in the body of fad24hi1019 mutants. Black arrows point to c-fms expression in the neural crest. F,F′: XZ projections of MPO-labeled WT and fad24hi1019 larvae. G,G′: ZY projections of MPO (green) and p63 (red, to mark the epidermis) double-immunolabeled larvae. White line, the midline of the larva. H: A 3.9-μm optical longitudinal section through the muscle of a fad24hi1019 larvae immunolabeled for MPO. All images except F,F′G,G′ are in lateral view, anterior to the left, and all images are at 3 dpf. Scale bar = 200 μm. Representative results from three experiments.