
Fig. 2
|
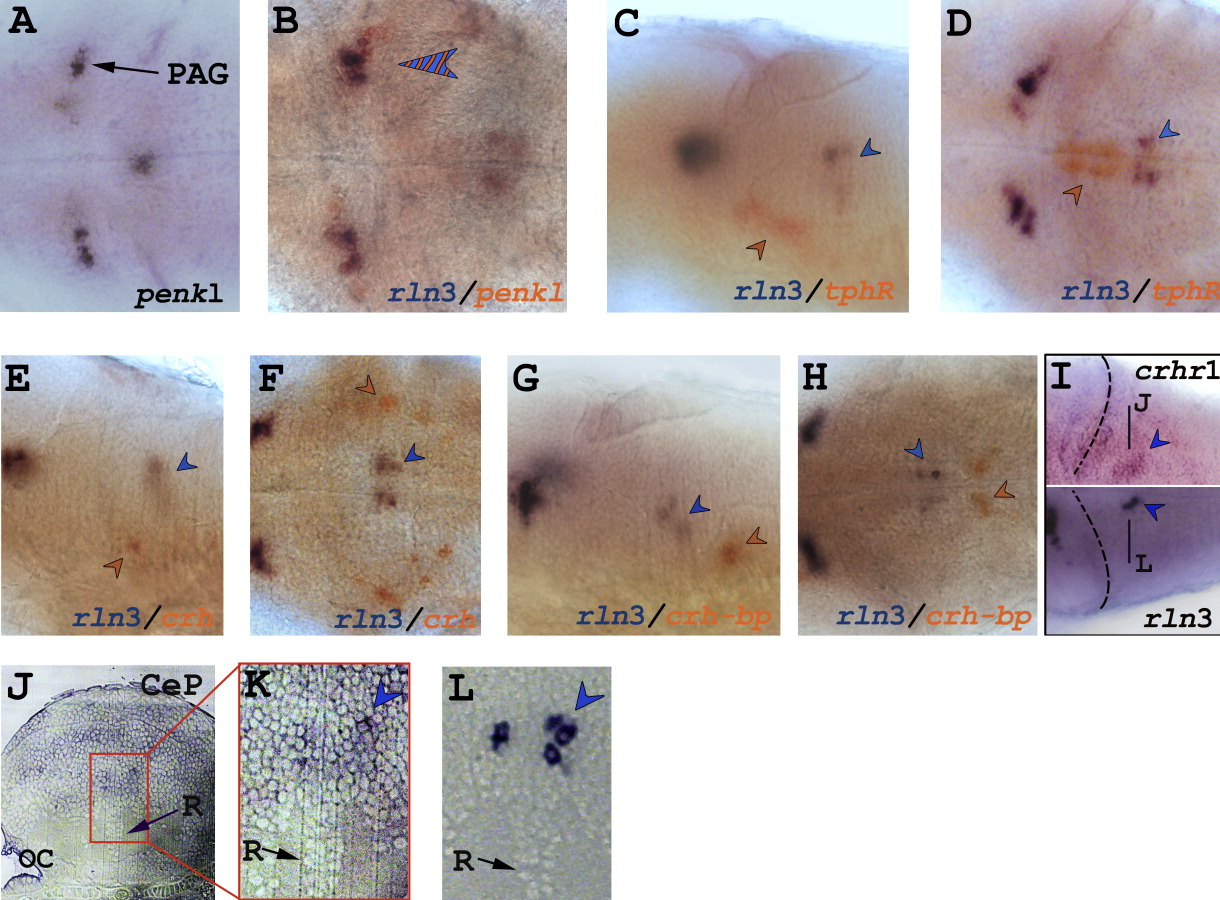
Fig. 2 Whole mount in situ hybridizations with marker genes for specific neural territories. A: penkl expression in the brain of embryos at 96 hpf. B: Double in situ hybridization with penkl (orange) and rln3 (blue). C-H: Double in situ hybridization on embryos at 72 hpf. rln3 (blue), tphR (orange, C, D), crh (orange, E, F), crh-bp (orange, G, H). I: Comparison of single in situ hybridizations for crh1 and rln3. J, K: Transverse section of hybridized embryos with crh1 antisense riboprobe, indicated by the black line in I and magnification as indicated in J. L: Magnification of a transverse section of hybridized embryo with rln3 antisense riboprobe centred at level of NI as indicated by the black line in I. A, B, D, F, H, I: Dorsal view of the brainstem region. C, E, G: Lateral view of the brainstem region. Blue arrowhead indicates rln3-expressing neurons in the NI. Orange arrowhead indicates: tphR-expressing neurons in the dorsal raphe (C, D); crh-expressing neurons in the locus coeruleus (E, F); crh-bp-expressing neurons in the superior raphe (G, H). Blue/orange arrowhead indicates colocalization of rln3 and penkl transcripts in the periaqueductal gray. CeP, cerebellar plate; OC, otic capsule; PAG, periaqueductal gray; R, raphe.