
|
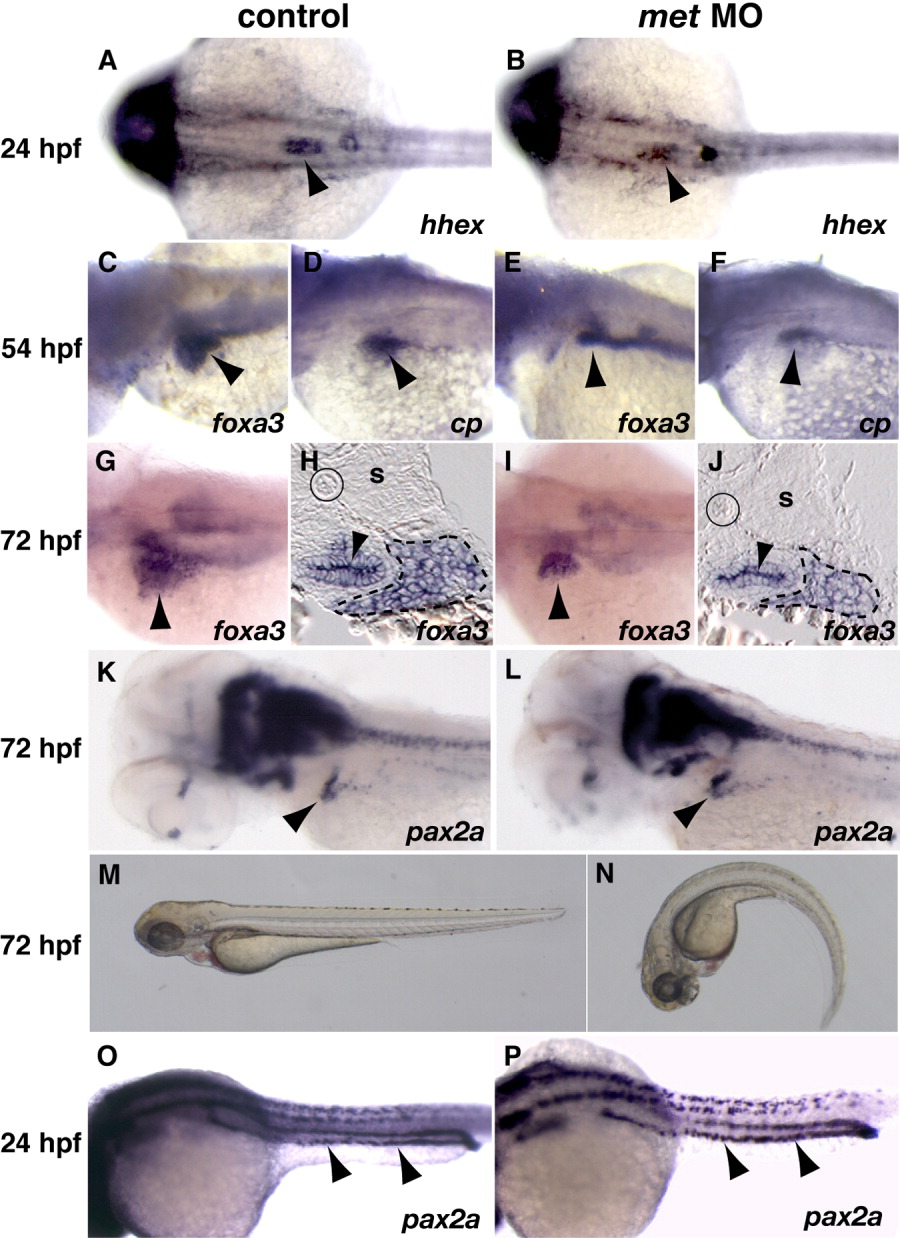
Fig. 4 Knockdown of Met function causes reduced liver size and a ventrally curved body axis. Control uninjected (A,C,D,G,H,K,M,O) and c-met AUG antisense MO injected (B,E,F,I,J,L,N,P) embryos. A,B: Dorsal views showing hhex expression in the liver primordium at 24 hr (arrowheads). C-F: Dorsolateral, left-sided views of 54-hr whole-mount embryos labeled with foxa3 and cp. Liver primordia are indicated by black arrowheads. G,I: Whole-mount embryos, dorsolateral views, showing liver foxa3 expression at 72 hr. H,J: Transverse sections of 72-hr embryos at approximately the same longitudinal plane showing foxa3 expression in the liver (dashed line) and gut (arrowhead). The positions of the notochord (solid black circle) and somite (s) are indicated. K,L: Whole-mount embryos, dorsolateral views, showing pax2a expression at 72 hr. Note that pax2a expression is reduced or absent in the pronephric duct (asterisks) and strongest in the pronephric tubule (arrowheads) by this stage in both uninjected control and MO-injected embryos. M,N: Lateral views of live 72-hr embryos. O,P: Pronephric tubule specification visualized by pax2a expression at 24 hr (arrowheads). Embryos in C-F and K and L were treated with PTU to reduce pigment.