FIGURE

Fig 3

ID
ZDB-FIG-240612-13
Publication
Prykhozhij et al., 2024 - miR-34a is a tumor suppressor in zebrafish and its expression levels impact metabolism, hematopoiesis and DNA damage
Other Figures
All Figure Page
Back to All Figure Page
Fig 3

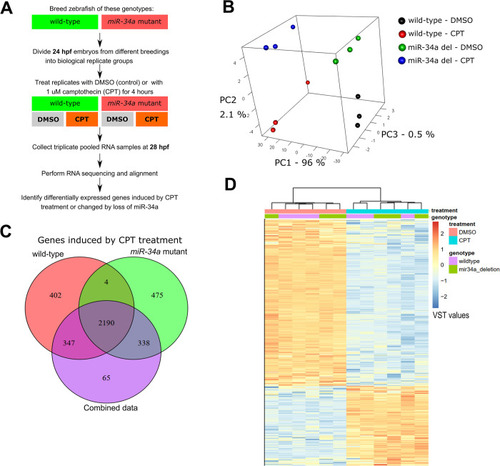
p53 activation by camptothecin treatment induces massive gene expression effects with a small contribution from miR-34a.

(A) Experimental design of the RNA sequencing experiment to analyze how miR-34a loss affects gene expression under normal and DNA damage treatment conditions. (B) Principal component analysis of gene expression values in all RNA sequencing samples. (C) Venn diagram for differentially expressed genes (DEGs) (fold-change ≥ 2 and FDR ≤ 0.05 as cut-offs) in the combined dataset (both genotypes), wild-type and miR-34a mutant subsets. (D) Hierarchical clustering of variance-stabilized transformed normalized counts (VST values) for all DEGs based on the treatment factor in full dataset. Treatment and genotype assignments are indicated at the top of the gene expression heatmap and the legend for the heatmap is shown to the right.

Expression Data

Expression Detail
Antibody Labeling
Phenotype Data

Phenotype Detail
Acknowledgments
This image is the copyrighted work of the attributed author or publisher, and ZFIN has permission only to display this image to its users. Additional permissions should be obtained from the applicable author or publisher of the image. Full text @ PLoS Genet.