FIGURE

Fig 6

ID
ZDB-FIG-240612-16
Publication
Prykhozhij et al., 2024 - miR-34a is a tumor suppressor in zebrafish and its expression levels impact metabolism, hematopoiesis and DNA damage
Other Figures
All Figure Page
Back to All Figure Page
Fig 6

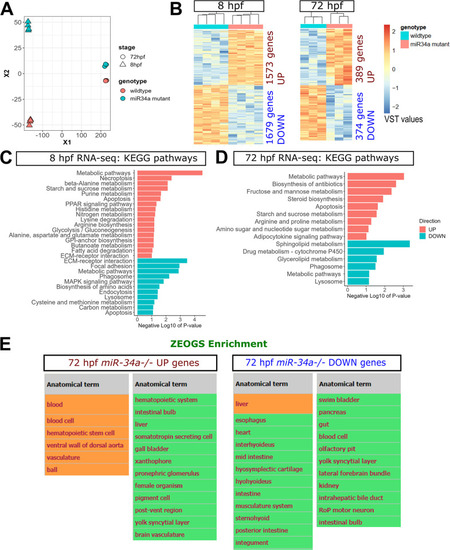
Expression profiling by RNA-seq of wild-type vs miR-34a-/- embryos at 8 and 72 hpf.

(A) Multi-dimensional scaling (MDS) 2-dimensional projection of RNA-seq count matrices for all samples. (B) Heatmaps of variance-stabilized transformed normalized counts (VST values) for samples at both stages with the numbers of genes up-regulated (UP) and down-regulated (DOWN) in miR-34a-/-. (C) KEGG pathway analysis for DEGs identified in the 8 hpf dataset. (D) KEGG pathway analysis for DEGs identified in the 72 hpf dataset. DEGs in 8 hpf and 72 hpf datasets were defined with fold-change ≥ 2 and FDR ≤ 0.05 as cut-offs. (E) REVIGO plot of Gene Ontology Biological Process terms identified for up-regulated genes in the 72 hpf dataset. (F) REVIGO plot of Gene Ontology Biological Process terms identified for down-regulated genes in the 72 hpf dataset. (G) Anatomical term enrichment using Zebrafish Expression Ontology of Gene Sets (ZEOGS) of both UP and DOWN-regulated genes in the 72 hpf dataset. Orange color indicates FDR q-value < 0.1 significance after Benjamini-Hochberg correction and green indicates P-value < 0.1 before correction.

Expression Data

Expression Detail
Antibody Labeling
Phenotype Data

Phenotype Detail
Acknowledgments
This image is the copyrighted work of the attributed author or publisher, and ZFIN has permission only to display this image to its users. Additional permissions should be obtained from the applicable author or publisher of the image. Full text @ PLoS Genet.