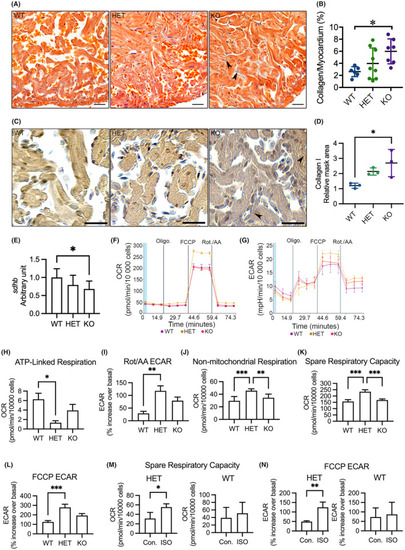
Analyses of myocardial interstitial fibrosis, cardiac OXPHOS gene expression and mitochondrial respiration in adult cardiomyocytes. (A) Representative images of acid fuchsin orange G (AFOG) staining of ventricular sections showing accumulation of collagen (blue) in the myocardium (orange). Arrowhead indicates accumulated collagen. (B) Quantification of AFOG staining indicating increased collagen accumulation in the myocardium in KO(52del). WT n = 6; HET(52del) n = 9; KO(52del) n = 7. (C) Representative images of immunohistochemical staining of ventricular sections for Collagen type I (brown). Arrowhead indicates Collagen type I‐positive signal. (D) Quantification of Collagen type I positive area relative to myocardium. WT n = 3; HET(52del) n = 3; KO(52del) n = 3. (E) RT‐qPCR analyses showing downregulation of OXPHOS complex II subunit sdhb in KO(52del) hearts compared to WT controls. sdhb, succinate dehydrogenase iron–sulfur subunit B; The graphs represent the quantification of two individual analyses of RNA extracts from pooled samples of two‐three hearts. Each analysis includes three replicates. WT n = 19; HET(52del) n = 19; KO(52del) n = 19. (F) Representative oxygen consumption (OCR) profile in zebrafish primary cardiomyocytes at basal respiration and after addition of oligomycin (Oligo.), carbonyl cyanide‐4 (trifluoromethoxy) phenylhydrazone (FCCP), followed by a combination of rotenone and antimycin A (Rot./AA). (G) Representative extracellular acidification (ECAR) profile in zebrafish primary cardiomyocytes at basal respiration and after addition of Oligo., FCCP and Rot./AA. (H) Cardiomyocytes from HET(52del) display a decline in the rate of respiration to drive mitochondrial ATP synthesis. (I) Cardiomyocytes from HET(52del) exhibit an increase in ECAR relative to the basal rate upon the addition of Rot./AA. (J) HET(52del) cardiomyocytes show increased non‐mitochondrial respiration. (K) HET(52del) cardiomyocytes show increased spare respiration capacity. (L) HET(52del) cardiomyocytes display increased ECAR relative to the basal rate upon the addition of FCCP. (M) Spare respiration capacity of HET(52del) and WT cardiomyocytes in response to ISO. (N) ECAR relative to the basal rate upon the addition of FCCP in HET(52del) and WT cardiomyocytes in response to ISO. (F–L) WT n = 15; HET(52del) n = 8; KO(52del) n = 7. M, N HET(52del) n = 15; WT n = 15. Data are presented as mean ± SD. One‐way ANOVA with Tukey adjustment for multiple comparisons in B, D, E and H–L. Two‐sample t‐test in M, N. *p < 0.05, **p < 0.01, ***p < 0.001. Scale bars: 20 μm.
|
