
Fig. 5
- ID
- ZDB-FIG-240112-26
- Publication
- Wang et al., 2023 - Amacrine cells differentially balance zebrafish color circuits in the central and peripheral retina
- Other Figures
- All Figure Page
- Back to All Figure Page
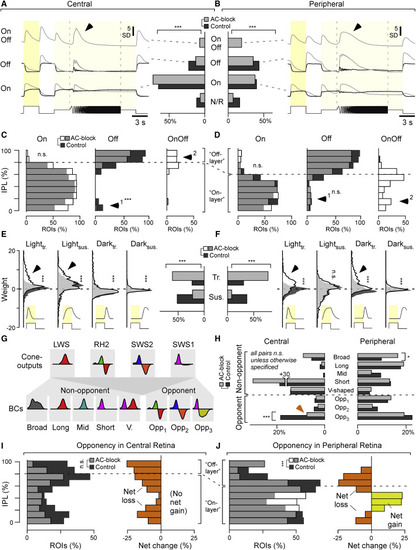
ACs differentially modulate grayscale processing in BCs across the eye (A and B) Bar plots: distribution of BC ROIs recorded in the central (A) and peripheral retina (B) by response polarity (non-responsive, On, Off, On-Off) before (control, dark gray) and after blocking inhibitory inputs (AC block, light gray), as indicated (chi-square tests for the bar plots, p < 0.001 for both datasets), and the corresponding mean response waveform to the white chirp stimulus (cf. Figure 4C) of all terminals in a given category. Arrowheads highlight distinct temporal dynamics during temporal flicker across the regions. Central: n = 1,492 ROIs under the control condition and 1,566 ROIs under the AC block condition from 13 scans in 13 fishes; peripheral: n = 1,526 ROIs under the control condition and 1,639 ROIs under the AC block condition from 13 scans in 13 fishes. (C and D) Distribution of On, Off, and On-Off BC terminals across the IPL, as indicated, with control data shown in dark gray and AC block data superimposed semi-transparently in white, so that overlapping bars appear in light gray. Note that the On/Off boundary differs between the central (C) and peripheral retina (D; see also Bartel et al.,18 Zimmermann et al.,19 and Zhou et al.33). Arrowheads highlight key differences between central and peripheral histogram pairs. Two-sample Kolmogorov-Smirnov test; central: On, p = 0.77; Off, p < 0.001; peripheral: On, p = 0.30; Off, p = 0.11. Because of the absence of data points under control conditions, no statistical tests were used to test changes for On-Off distributions. (E and F), Distribution of kinetic component weights used to fit BCs’ white step responses (cf. Figure S1B; STAR Methods) across the datasets and conditions as indicated (vertical histograms) and distribution into overall transient and sustained response types (bar plots). Arrowheads highlight the major differences across control and AC block conditions in each case. Wilcoxon rank-sum test for the distribution plots, p = 0.93 for the peripheral lightsus group, p < 0.001 for all other groups; chi-square test for the bar plots, p < 0.001 for both datasets. (G) Illustration of how cone input could build the different spectral response types in BCs. Insets indicate approximate spectral tuning functions (amplitude y versus wavelength x). The top row shows the four cones,7 and the bottom row shows BCs,18,19 divided into five non-opponent and three opponent categories. (H) Percentages of ROIs per spectral category (cf. G) based on BC kernels (cf. Figure 4E) for central (left) and peripheral datasets (right). Note that the distribution across spectral categories differs strongly by retinal region, but within a region, most spectral categories are approximately stable between control (dark gray) and AC block conditions (light gray). The main exception to this observation is indicated by the arrow. Wilcoxon rank-sum tests, central: p > 0.05 for the first 7 groups, p < 0.001 for “Opp3” group; peripheral: p = 0.015 for the “Broad” group, p > 0.05 for all others. (I and J) Left: IPL distributions (I, central retina; J, peripheral retina) of all ROIs classed as color opponent during the control condition (dark gray) and following AC block (white, so that their overlay is light gray). Right: difference between control and AC block in each case, with net loss of opponency shown in orange and net gain in yellow. The full datasets leading to the summaries in (H–J) are shown in Figures S7B–S7E. Two-sample Kolmogorov-Smirnov test for changes in IPL distributions of opponent terminals; central, p = 0.39; peripheral, p < 0.001. |