
Fig. 1
- ID
- ZDB-FIG-240112-22
- Publication
- Wang et al., 2023 - Amacrine cells differentially balance zebrafish color circuits in the central and peripheral retina
- Other Figures
- All Figure Page
- Back to All Figure Page
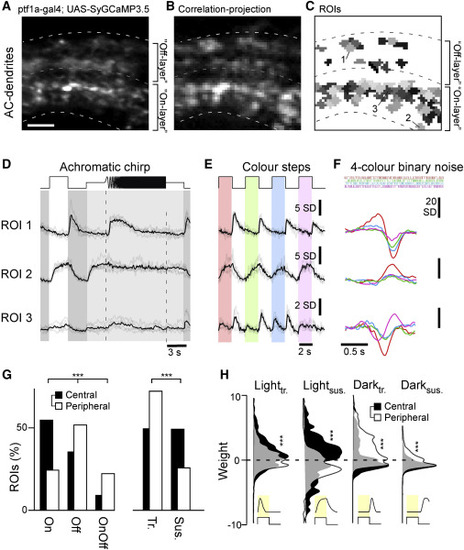
Recording AC functions in vivo (A–C) Example scan of syGCaMP3.5-expressing AC dendrites within the IPL, showing the scan average (A); a projection of local response correlation, indicating regions of high activity (B); and the correspondingly placed ROI map (C). Scale bar, 5 μm. (D–F) Example regions of interest (ROIs, cf. C), with mean trial averages (black) superimposed on individual repeats (gray) to the three light stimuli tested: an achromatic chirp stimulus (D), four spectrally distinct steps of light from dark (red, green, blue, UV, as indicated; STAR Methods) (E), and a spectral noise stimulus used to establish linear filters (kernels) at the same four wavelengths (F). (G) Distribution of ROIs from the central (black, n = 927 ROIs, 10 scans, 6 fish) and peripheral retina (white, n = 816 ROIs, 10 scans, 6 fish) by polarity (On/Off/On-Off) and kinetics (transient/sustained). Chi-square test, p < 0.001 for both datasets. (H) Distribution of kinetic component weights (STAR Methods; cf. Figure S1B) of central and peripheral ROIs. Wilcoxon rank-sum test, p < 0.001 for all four datasets. |