
Figure 4
- ID
- ZDB-FIG-221226-318
- Publication
- Bandla et al., 2022 - A New Transgenic Tool to Study the Ret Signaling Pathway in the Enteric Nervous System
- Other Figures
- All Figure Page
- Back to All Figure Page
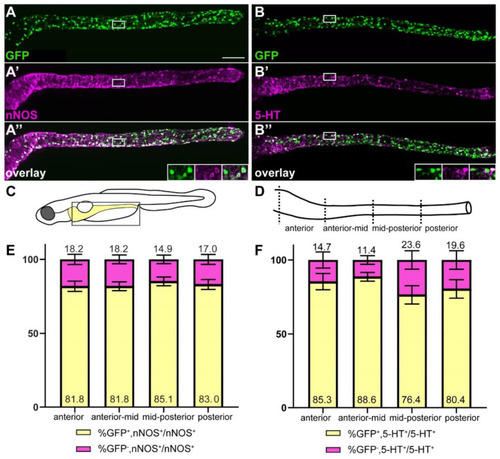
The majority of nitrergic and serotonergic neurons are GFP+. ret:GFP is expressed in the majority of nitrergic (A–A”) and serotonergic (B–B”) neurons (white). Insets in (A”,B”) show close-up of the boxed area, GFP, nNOS or 5-HT, and overlay from left to right. Schematic of boxed area of larval schematic (C) indicates the four gut sub-regions analyzed (D). (E) Quantification of GFP and nNOS colocalization in four gut regions as shown in (D). Bar graph shows % GFP+/nNOS+ out of total nNOS+ cells (yellow), and % GFP−/nNOS+ out of total nNOS+ cells (magenta). Error bars show ±standard error of the mean (2 experiments, 23 larvae). (F) Quantification of GFP and 5-HT colocalization in four gut regions shown in D. Bar graph shows % GFP+/5-HT+ out of total 5-HT+ cells (yellow), and % GFP−/5-HT+ out of total 5-HT+ cells (magenta). Using 2-way ANOVA, we did not find significant differences between the cell population of the different gut regions. Error bars show ±standard error of the mean (2 experiments, 22 larvae). (A–A”,B–B”): maximum projections of dissected guts. Scale bar = 100 µm. |