
Fig. 1
- ID
- ZDB-FIG-221222-27
- Publication
- Terai et al., 2021 - Electrophysiological and pharmacological characterization of spreading depolarization in the adult zebrafish tectum
- Other Figures
- All Figure Page
- Back to All Figure Page
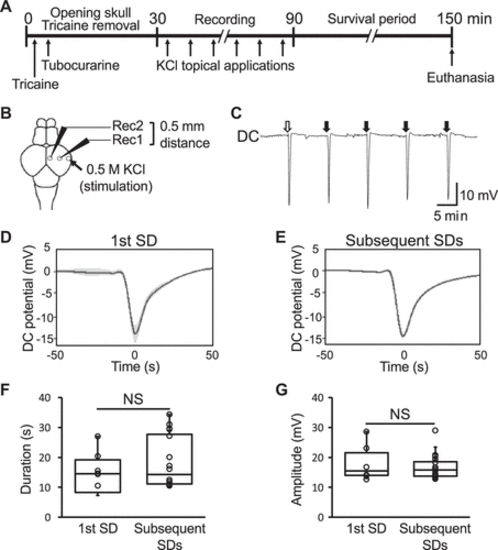
Figure 1.Direct current (DC) potential shift in the adult zebrafish tectum upon chemical stimulation. A: a schematic of the experimental electrophysiological recording process of the extracellular potential in the adult zebrafish tectum. B: a schematic dorsal view of the adult zebrafish brain showing the position of the recording electrodes with an interelectrode distance of 0.5 mm (Rec1 and Rec2) and the KCl stimulation site (arrow). C: a representative trace of the DC extracellular potential recorded in the tectum. The lateral side of the tectum was stimulated every 10 min as indicated by the white (first spreading depolarization, SD) and black (subsequent SDs) arrows. D and E: line plots of the DC potential shifts associated with KCl stimulation showing the mean of the first (D, n = 6 SDs) and subsequent (E, n = 85 SDs) SDs recorded in the sessions. Data are presented as the means (solid lines) ± standard error (SE, shaded area). Bar graphs with dot-whisker plots of the duration at half of the maximal amplitude (F) and amplitude (G) of the first and subsequent SDs. NS, not significant. |