
Fig. 3
- ID
- ZDB-FIG-220705-63
- Publication
- Perl et al., 2022 - Stx4 is required to regulate cardiomyocyte Ca2+ handling during vertebrate cardiac development
- Other Figures
- All Figure Page
- Back to All Figure Page
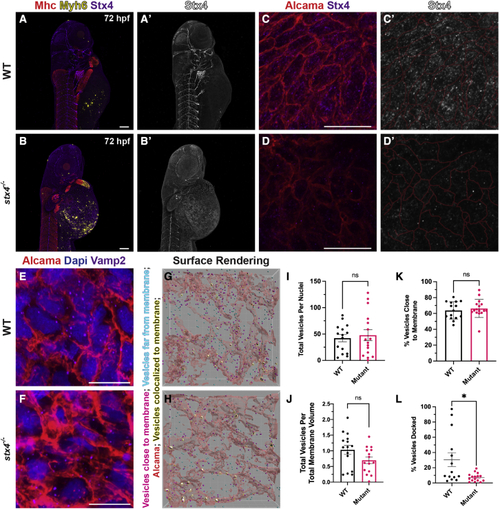
stx4 mutants exhibit loss of Stx4 expression and function (A and B) Confocal images of 72 hpf WT or stx4 mutant larvae labeled using IHC markers for Mhc (striated muscle - red), Myh6 (atrial CMs - yellow) and Stx4 (purple). (A′and B′) Single channel confocal images of Stx4. Scale bars, 100 μM. (C and D) Confocal images of 72 hpf WT and stx4 mutant CM membranes labeled with Alcama (red), and Stx4 (purple). Scale bars, 10 μM (C′and D′) Single channel confocal images of Stx4. Membranes (red lines) from (C and D) are indicated. (E and F) Confocal images of 72 hpf WT and stx4 mutant CM membranes labeled with DAPI (nuclei; blue), Alcama (red), and Vamp2 (purple). Scale bars, 10 μM. (G and H) Imaris surface rendering of max intensity projections of Vamp2 from (E and F). Red surfaces indicate Alcama-labeled sarcolemma; yellow-highlighted white surfaces indicate overlapping vesicle surfaces; magenta spots indicate vesicles identified within the threshold as close to the membrane surface; cyan spots indicate vesicles outside this threshold. (I and J) Total Vamp2+ vesicles from spot rendered puncta normalized to nuclei or cell membrane volume. Vesicles were quantified via spot rendering of puncta labeled with Vamp2. Membrane volumes were obtained from surface renderings of Alcama labeling. Data are represented as the mean ± SEM, n = 15 WT/stx4+/− and n = 16 stx4−/− larvae, Student’s t test. (K) Vamp2+ vesicles quantified near Alcama-labeled membrane surface threshold of 72 hpf WT or stx4 mutant CMs. Data are represented as the mean ± SEM, n = 15 WT/stx4+/− and n = 16 stx4−/− larvae, Student’s t test. (L) Quantification of the percent of colocalized Vamp2+ vesicles over total number of vesicles of 72 hpf WT or stx4 mutant CMs. Vesicle surfaces were colocalized to the CM membrane by masking overlapping surfaces. Data are represented as the mean ± SEM, n = 14 WT/stx4+/− and n = 16 stx4−/− larvae, Student’s t test ∗p < 0.05. |
| Genes: | |
|---|---|
| Antibodies: | |
| Fish: | |
| Anatomical Terms: | |
| Stage: | Protruding-mouth |
| Fish: | |
|---|---|
| Observed In: | |
| Stage: | Protruding-mouth |