
Fig. 3
- ID
- ZDB-FIG-220701-46
- Publication
- Oliveira et al., 2022 - Mutant IL7R collaborates with MYC to induce T-cell acute lymphoblastic leukemia
- Other Figures
- All Figure Page
- Back to All Figure Page
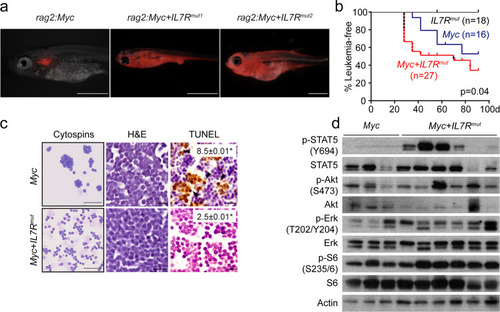
Mutant IL7R collaborates with Myc to accelerate T-ALL onset.
a Tu/AB-strain fish injected at the one-cell stage with either rag2:Myc alone or with rag2:IL7Rmut1 or rag2:IL7Rmut2. Animals were also co-injected with rag2:mCherry to visualize leukemia onset and progression. Representative images of transgenic mosaic zebrafish at 28 dpf; Panels are merged fluorescent and brightfield images; Scale bar, 1 mm. b Kaplan−Meier analysis (Gehan-Breslow-Wilcoxon test). Number of animals analyzed per genotype is shown in parenthesis. Red dots denote fish that developed leukemia from rag2:Myc + rag2:IL7Rmut1 injected fish, whereas black dots show leukemias developing in rag2:Myc + rag2:IL7Rmut2 fish. c May-Grünwald and Wright-Giemsa stained cytospins showing lymphoblast morphology (n ≥ 2 leukemias/genotype analyzed); Scale bar, 50 µm. Histological analysis of primary T-ALLs (n > 3 leukemias/genotype analyzed); Hematoxylin and eosin-stained sections juxtaposed to immunohistochemistry for TUNEL; Arrowheads denote examples of positively stained cells; Scale bar, 10 µm. Percent positive cells ± SEM are shown within each image panel. Asterisks denote significant differences between Myc and Myc + IL7Rmut leukemias as assessed by Student’s t test. d Immunoblot analysis of phosphorylated protein levels in bulk leukemias or FACS-sorted T-ALL cells (n ≥ 3/genotype). |