
Fig. 1
- ID
- ZDB-FIG-220701-44
- Publication
- Oliveira et al., 2022 - Mutant IL7R collaborates with MYC to induce T-cell acute lymphoblastic leukemia
- Other Figures
- All Figure Page
- Back to All Figure Page
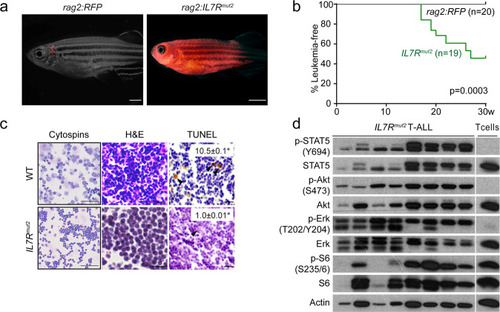
IL7R mutational activation alone drives T-ALL in zebrafish.
a Stable transgenic rag2:RFP and rag2:IL7Rmut2-tdTomato zebrafish were followed for disease onset and progression. Representative images of stable transgenic zebrafish at 17 weeks of life. Panels are merged fluorescent and brightfield images. Scale bar, 2 mm. b Kaplan–Meier analysis of disease progression in stable transgenic zebrafish (Gehan-Breslow-Wilcoxon statistic). Number of animals analyzed per genotype is shown in parenthesis. c May-Grünwald and Wright-Giemsa stained cytospins of kidney marrow from wild-type fish and bulk leukemias of rag2:IL7Rmut2-tdTomato fish (left panels); Scale bar, 50 µm. Histological analysis of thymic cells from wild-type fish (n = 4) and primary T-ALLs (n ≥ 6); Hematoxylin and eosin-stained sections juxtaposed to immunohistochemistry for TUNEL (right panels). Arrowheads denote examples of positively stained cells. Scale bar equals 10 µm. Percent positive cells ± SEM are shown within each image panel. Asterisks denote significant differences as assessed by Student’s t test. d Immunoblot analysis of phosphorylated protein levels in normal rag2:RFP thymocytes and bulk leukemias or FACS-sorted T-ALL cells from stable transgenic animals (n = 8). |
| Fish: | |
|---|---|
| Observed In: | |
| Stage: | Adult |