|
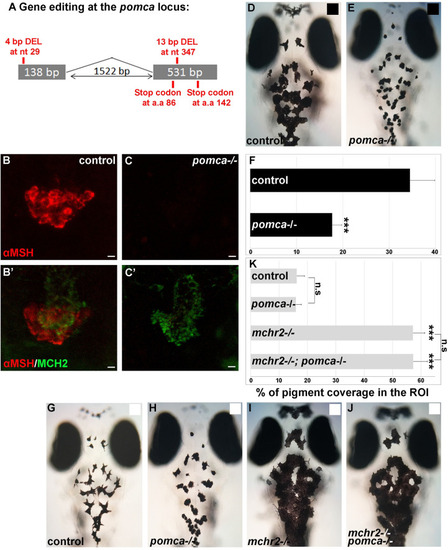
<italic>pomca</italic> loss of function leads to melanosomes contraction, but is not sufficient to rescue the <italic>mchr2</italic> mutant phenotype in larvae.(A) Schematic representation of the pomca locus and the small genomic deletions induced by CRISPR/Cas-9 leading to premature stop codons in the pomca coding sequence. (B-C’) Confocal projection (B, C) or section (B’, C’) of double immunolabelling with MCH2 and α-MSH antibody at 5 dpf, showing that MCH expression, but not α-MSH, is detected in the pomca homozygous mutant. (D, E) Dorsal melanocytes of control (D) or pomca homozygous mutant (E) black adapted larvae at 7 dpf. (F) Melanosome coverage was quantified in control or pomca homozygous mutant black adapted larvae at 7 dpf. (G-J) Dorsal melanocytes of control (G), pomca homozygous mutant (H), mchr2 homozygous mutant (H) or pomca; mchr2 double homozygous mutant (J) white adapted larvae at 7 dpf. (K) Melanosome coverage was quantified in control, pomca homozygous mutant, mchr2 homozygous mutant or pomca; mchr2 double homozygous mutant white adapted larvae at 7 dpf. Dorsal view with anterior up (D, E and G-J). Scale bars: 10 μm. Error bars represent s.d. *P<0.05, **P<0.001, ***P<0.0005, determined by t-test, two-tailed.
|