
FIGURE
Figure 7
Figure 7
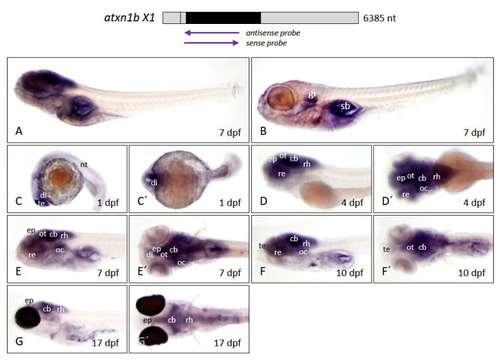
Figure 7. Atxn1b expression pattern in zebrafish embryos and larvae. Whole-mount in situ hybridization was performed in embryos and larvae of the brass and casper line at different developmental stages. (A) Expression domains of atxn1b in whole larva (7 dpf) detected by antisense probes in the coding region of the transcript, marked by the upper left arrow below the schematized transcript (upper panel). (B) Background staining in whole larva (7 dpf) after use of sense probes (right arrow, upper panel). Lateral (C–F) and dorsal (C′–F′) views of atxn1b expression domains of brass zebrafish during embryonic and larval development (1, 4, 8, and 10 dpf). (G) lateral and (G′) dorsal view of atxn1b expression domains in 17 dpf casper larva. Abbreviations: cb (cerebellum), di (diencephalon), ep (epiphysis), gi (gills), nt (neural tube), oc (otic capsule), ot (optic tectum), re (retina), rh (rhombencephalon), sb (swim bladder), te (telencephalon).
|
Expression Data
| Gene: | |
|---|---|
| Fish: | |
| Anatomical Terms: | |
| Stage Range: | Prim-5 to Days 14-20 |
Expression Detail
Antibody Labeling
Phenotype Data
Phenotype Detail
Acknowledgments
This image is the copyrighted work of the attributed author or publisher, and
ZFIN has permission only to display this image to its users.
Additional permissions should be obtained from the applicable author or publisher of the image.
Full text @ Int. J. Mol. Sci.