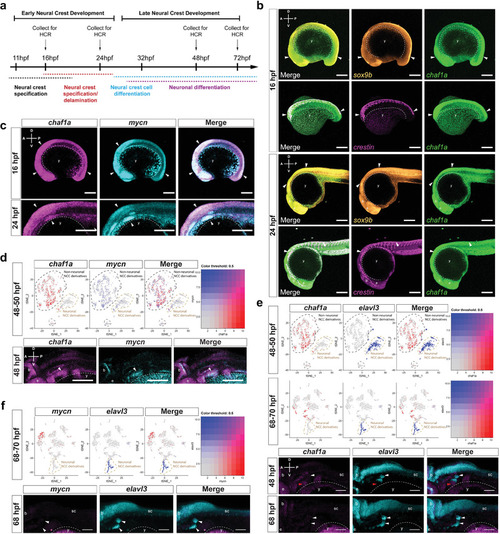
CHAF1A blocks NC differentiation. a) Schematic presentation of early NCC events during zebrafish development. hpf = hours post fertilization. b) Spatial‐temporal expression of sox9b, crestin, and chaf1a in 16 hpf and 24 hpf embryos by hybridization chain reaction (HCR). A (anterior), P (posterior), D (dorsal), and V (ventral) axes shown in upper left corner. c) Spatial‐temporal expression of chaf1a and mycn in 16 hpf and 24 hpf embryos by HCR. d) Top: tSNE plots with relative expression levels of chaf1a and mycn in NCC and NCC derivatives at 48–50 hpf (red = chaf1a, blue = mycn, magenta = both). Bottom: HCR against chaf1a and mycn in 48 hpf embryos. Arrowheads: populations co‐expressing chaf1a and mycn. e) Top: tSNE plots with relative expression of chaf1a and elavl3 in NCC and NCC‐derivatives at 48–50 hpf and at 68–70 hpf (red = chaf1a, blue = elavl3, magenta = both). Bottom: HCR against chaf1a and elavl3 in 48 hpf and 70 hpf embryos. White arrowheads: developing cranial ganglia (elavl3+); red arrowheads: surrounding non‐neuronal tissue (chaf1a+). f) Top: tSNE plots with relative expression of mycn and elavl3 in NCC and NCC‐derivatives at 68–70 hpf (red = mycn, blue = elavl3, magenta = both). Bottom: HCR against mycn and elavl3 in 70 hpf embryos. White arrowheads: developing cranial ganglia (elavl3+). g) Diagram for ectopic expression of human CHAF1A in zebrafish NCCs. h) Percentage of GFP+/mCherry+ or GFP+/CHAF1A+ clones that also express Elavl3. i) Representative image from a sox10: mCherry‐IRES‐EGFP and a sox10:CHAF1A‐IRES‐EGFP injected embryo. Markers: EGFP (green), gene of interest (GOI) either mCherry or CHAF1A (red), and Elavl3 (cyan). White arrowheads: GFP+/GOI+, GFP+/mCherry+, or GFP+/CHAF1A+ clones; tan arrowheads: GFP+/GOI+/Elavl3+ clones. j) CHAF1A expression in neurons versus NCCs in a hESCs‐derived NCC induction and differentiation model. Left: schematic representation of the hNC model. Middle: TFAP2A and TUJ1 immunofluorescence staining in NCCs and neurons, respectively. Right: qPCR analysis of NCC markers (SOX9 and TFAP2A) and neuron markers (TUBB3, which encodes TUJ1, and MAPT) in NCCs and neurons. Data are presented as the mean ± SD (n = 2); two‐sided unpaired t‐test, *p < 0.05, **p < 0.01. k) Left: schematic representation of NCC induction and RA‐induced differentiation into mature neurons with or without CHAF1A overexpression. Middle: immunofluorescence staining of TUJ1 with or without CHAF1A overexpression. Right: percentages of TUJ1 positive cells are quantified with Image J2. Mean ± SD (n = 6); two‐sided unpaired t‐test, ****p < 0.0001. Scale bars = 100 µm in (a–f), (j), (k), and uncropped images in (i); Scale bars = 25 µm for cropped images in (i). y = yolk sac, e = developing eye, b = developing brain, sc = developing spinal cord.
|
