
Fig. 2
- ID
- ZDB-FIG-210507-4
- Publication
- Valera et al., 2021 - A neuronal blueprint for directional mechanosensation in larval zebrafish
- Other Figures
- All Figure Page
- Back to All Figure Page
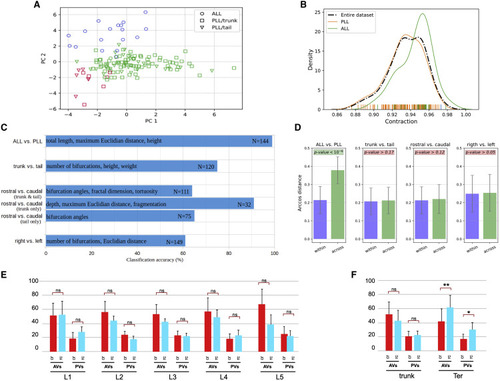
Morphometric analysis and classification of LANs (A) Distribution of original neuron type labels projected onto the first two principal components (PC) according to unsupervised Gaussian Mixture Models clustering based on morphometrics. The only clear alignment is with a 2-class separation, which matches ALL (aLANs) and PLL (pLANs). (B) Probability distribution functions of Contraction values (which measure neuronal branch tortuosity or meandering) for the whole cell population and for ALL and PLL neurons separately. The ALL and PLL distributions correspond to the peak of the bimodal Contraction distribution, confirming discrete rather than continuum classes. (C) Classification accuracy (expressed as percent correct on the horizontal scale) for distinguishing between various subsets of axonal projections based on their morphometric parameters. The most discriminant features are reported in each case along with the sample size corresponding to each grouping. (D) Persistence diagram vector analysis demonstrates that only aLANs/pLANs arcosine distances were statistically smaller within classes than across classes. (E) Comparison of the number of AVs and PVs between caudorostral pLANs (crpLANs, red) and rostrocaudal LANs (rcpLANs, blue). (F) Comparison of AVs and PVs between crpLANs (red) and rcpLANs (blue) in LANs from L1 to L5 analyzed as a whole (L1-L5_pLANs) and terminal LANs (Ter-LANs). See also Figure S2 and Video S1. |