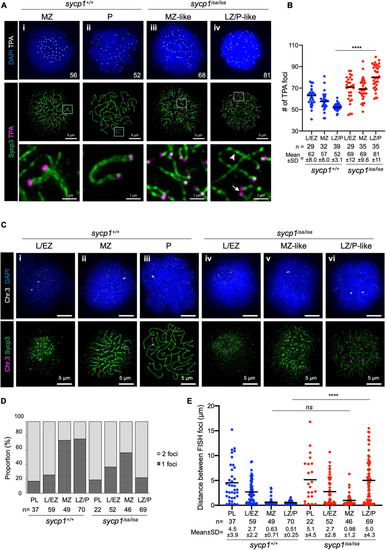
Transient pairing of homologs at chromosome ends in sycp1 mutant spermatocytes. (A) costaining of telomeres (TPA) and Sycp3 in sycp1+/+ (i and ii) and sycp1isa/isa (iii and iv) spermatocytes. The arrowhead indicates complete axis formation between two telomeres, and the arrow indicates paired telomere foci in LZ/P-like sycp1isa/isa spermatocytes. Numbers in the top panels indicate counts of TPA foci. Regions indicated in white rectangles are shown at a higher magnification at the bottom. (B) quantification of telomere polyamide (TPA) foci in sycp1+/+ and sycp1isa/isa spermatocytes. Black bars indicate means. Statistical significance was examined by a two-tailed Mann-Whitney test (****P < 0.0001; exact P value). (C) fish staining of a peritelomeric locus on chromosome 3 in sycp1+/+ (i to iii) and sycp1isa/isa (iv to vi) spermatocytes. (D) Proportion of nuclei with one or two FISH foci in sycp1+/+ and sycp1isa/isa spermatocytes. (E) quantification of distances between FISH foci of a peritelomeric locus on chromosome 3 in sycp1+/+ and sycp1isa/isa spermatocytes. Distances between FISH foci observed in Figure 4D. For nuclei with only one FISH focus, the radius of the FISH-stained area was considered the distance between two FISH foci. Black bars indicate means. Statistical significance was examined by a two-tailed Mann-Whitney test (****P < 0.0001, ns, not significant; exact P value).
|
