
Figure 1.
- ID
- ZDB-FIG-210319-5
- Publication
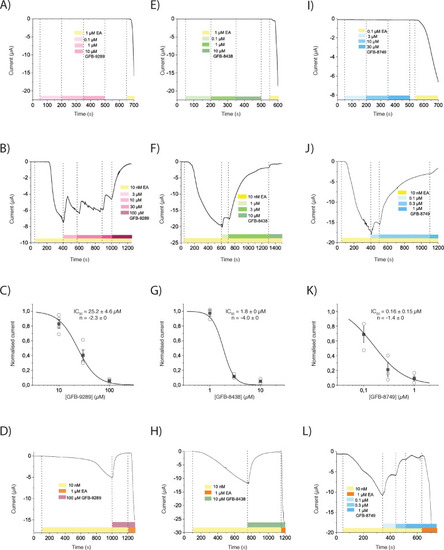
- Vinayagam et al., 2020 - Structural basis of TRPC4 regulation by calmodulin and pharmacological agents
- Other Figures
-
- Figure 1.
- Figure 2
- Figure 2—figure supplement 1.
- Figure 2—figure supplement 2.
- Figure 2—figure supplement 3.
- Figure 2—figure supplement 4.
- Figure 2—figure supplement 5.
- Figure 3
- Figure 3—figure supplement 1.
- Figure 4
- Figure 4—figure supplement 1.
- Figure 4—figure supplement 2.
- Figure 5
- Figure 5—figure supplement 1.
- Figure 5—figure supplement 2.
- Figure 5—figure supplement 3.
- Figure 5—figure supplement 4.
- Figure 5—figure supplement 5.
- Figure 5—figure supplement 6.
- Figure 6.
- Figure 7.
- All Figure Page
- Back to All Figure Page
( |