
FIGURE
Figure 2—figure supplement 3.
- ID
- ZDB-FIG-210319-10
- Publication
- Vinayagam et al., 2020 - Structural basis of TRPC4 regulation by calmodulin and pharmacological agents
- Other Figures
-
- Figure 1.
- Figure 2
- Figure 2—figure supplement 1.
- Figure 2—figure supplement 2.
- Figure 2—figure supplement 3.
- Figure 2—figure supplement 4.
- Figure 2—figure supplement 5.
- Figure 3
- Figure 3—figure supplement 1.
- Figure 4
- Figure 4—figure supplement 1.
- Figure 4—figure supplement 2.
- Figure 5
- Figure 5—figure supplement 1.
- Figure 5—figure supplement 2.
- Figure 5—figure supplement 3.
- Figure 5—figure supplement 4.
- Figure 5—figure supplement 5.
- Figure 5—figure supplement 6.
- Figure 6.
- Figure 7.
- All Figure Page
- Back to All Figure Page
Figure 2—figure supplement 3.
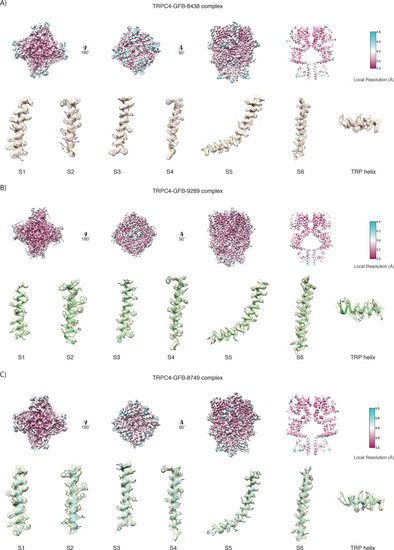
Maps of GFB-8438, GFB-9289 and GFB-8749-bound TRPC4, respectively, colored according to the local resolution. Representative regions of the density with the fitted atomic model are shown below the local resolution maps. |
Expression Data
Expression Detail
Antibody Labeling
Phenotype Data
Phenotype Detail
Acknowledgments
This image is the copyrighted work of the attributed author or publisher, and
ZFIN has permission only to display this image to its users.
Additional permissions should be obtained from the applicable author or publisher of the image.
Full text @ Elife