
Fig. 3
- ID
- ZDB-FIG-210216-71
- Publication
- Rieckhoff et al., 2020 - Spindle Scaling Is Governed by Cell Boundary Regulation of Microtubule Nucleation
- Other Figures
- All Figure Page
- Back to All Figure Page
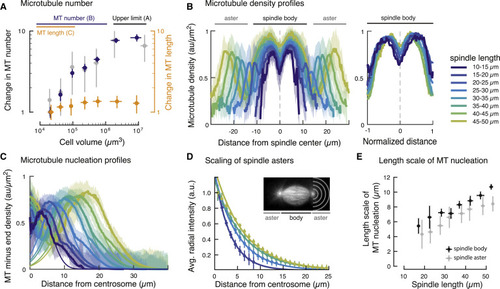
Figure 3. Microtubule Nucleation Determines Spindle Scaling and Architecture (A) The number of microtubules (MTs) within the spindle decreases 10-fold during spindle scaling. Microtubule number NMT was calculated from measurements of spindle mass Mspd and microtubule length LMT (NMT = Mspd / LMT, in blue), and laser ablation (in gray, see STAR Methods). For comparison, the change in microtubule length during spindle scaling is shown in orange. Error bars denote SDs obtained from error propagation. (B) Left: microtubule density profiles scale with spindle size. Right: rescaled microtubule density profiles in the spindle body are shape invariant (n = 210). Shaded regions denote SDs. (C) Microtubule nucleation profiles for microtubules of the same polarity show that nucleation occurs throughout the spindle (see also Figure S5). Thin solid lines correspond to Gaussian fits to estimate the length scale of microtubule nucleation. (D) Spindle asters scale with spindle length. The size of spindle asters was determined by radially averaging the tubulin fluorescence intensity at different distances from the centrosome (denoted by gray half circles, n = 165). The normalized radial fluorescence intensities decay exponentially with distance from the centrosome—indicative of non-centrosomal microtubule nucleation (solid lines) and consistent with astral microtubules nucleated away from centrosomes. Error bars correspond to SDs. (E) The extent of microtubule nucleation in the spindle body (in black) and in the asters (in gray) increases linearly with spindle length (mean ± SD). |