
- Title
-
Spindle Scaling Is Governed by Cell Boundary Regulation of Microtubule Nucleation
- Authors
- Rieckhoff, E.M., Berndt, F., Elsner, M., Golfier, S., Decker, F., Ishihara, K., Brugués, J.
- Source
- Full text @ Curr. Biol.
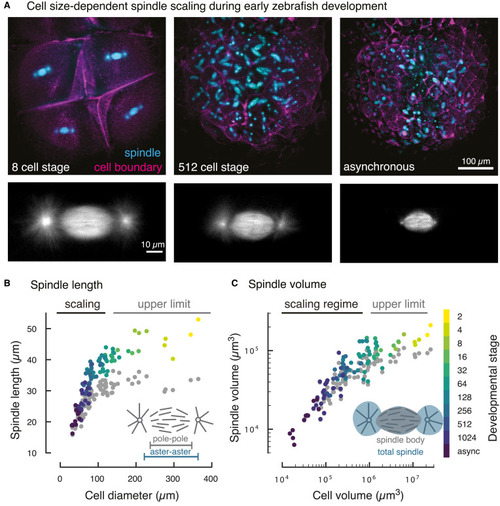
Figure 1. Cell Size-Dependent Spindle Scaling during Early Zebrafish Development (A) 3D light-sheet microscopy of spindles and cell boundaries in zebrafish embryos. Maximum intensity projections of a fluorescently labeled zebrafish embryo at selected developmental stages (see Video S1). (B) Spindle scaling in early zebrafish embryos covers two regimes. In large cells, spindle length remains constant (“upper limit”). Below a critical cell diameter (dcell = 125 μm), spindle length scales linearly with cell diameter. Each dot denotes an individual measurement of aster-to-aster spindle length (color-coded by developmental stage) or pole-to-pole spindle length (in gray, 96 analyzed spindles and cells in four different embryos). (C) 3D segmentation of spindles and cells (see Figure S1) yields the scaling relationship between spindle volume and cell volume. The scaling of the total spindle volume (including asters, color-coded by cell stage) and the spindle body volume (excluding asters, gray) is nearly indistinguishable. |
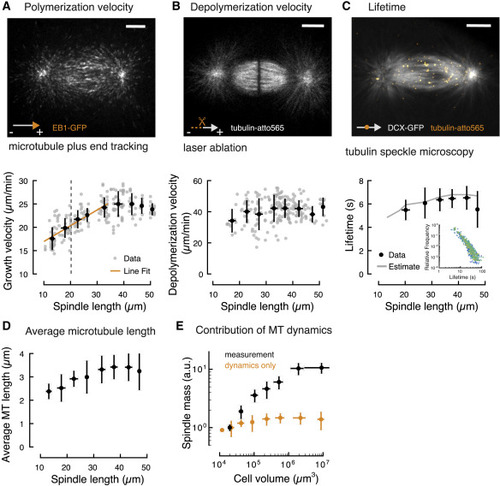
Figure 2. Microtubule Dynamics Are Insufficient to Account for Spindle Scaling (A) Quantification of microtubule polymerization in spindles of different sizes during early zebrafish development shows two regimes (see also Figure S2 and Video S3). Microtubule growth velocity scales linearly with spindle length (aster-aster) in spindles smaller than 35 μm. In larger spindles, microtubule polymerization velocity remains constant. Individual and binned measurements are shown in gray (n = 196) and black, respectively (mean ± SD, bin size 5 μm). Gray dotted line represents the estimated transition to zygotic genome activation (ZGA) corresponding to spindles on the left side of the line. Scale bar, 10 μm. (B) Laser ablation reveals that microtubule depolymerization velocity is independent of spindle length (see also Figure S3 and Video S4; n = 202, mean ± SD, bin size 5 μm). Scale bar, 10 μm. (C) Tubulin speckle microscopy reveals that microtubule lifetimes are constant in spindles of different sizes (see also Figure S4 and Video S5). Solid gray line is the estimate derived from changes in the microtubule polymerization velocity observed during scaling (STAR Methods). Inset shows the measured speckle lifetime distributions color-coded by spindle length (n = 47, mean ± SD). Scale bar, 10 μm. (D) Microtubule (MT) length correlates with spindle size in spindles smaller than 35 μm but remains constant in larger spindles. Average microtubule length obtained from the measured microtubule dynamics (STAR Methods). Error bars are obtained from error propagation of the measurements of microtubule dynamics. (E) Modulation of microtubule dynamics is not sufficient to account for spindle scaling. The estimated scaling of spindle mass from microtubule dynamics alone (in orange) is significantly lower than the measured spindle mass (in black). |
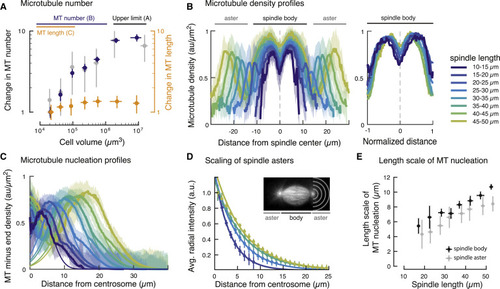
Figure 3. Microtubule Nucleation Determines Spindle Scaling and Architecture (A) The number of microtubules (MTs) within the spindle decreases 10-fold during spindle scaling. Microtubule number NMT was calculated from measurements of spindle mass Mspd and microtubule length LMT (NMT = Mspd / LMT, in blue), and laser ablation (in gray, see STAR Methods). For comparison, the change in microtubule length during spindle scaling is shown in orange. Error bars denote SDs obtained from error propagation. (B) Left: microtubule density profiles scale with spindle size. Right: rescaled microtubule density profiles in the spindle body are shape invariant (n = 210). Shaded regions denote SDs. (C) Microtubule nucleation profiles for microtubules of the same polarity show that nucleation occurs throughout the spindle (see also Figure S5). Thin solid lines correspond to Gaussian fits to estimate the length scale of microtubule nucleation. (D) Spindle asters scale with spindle length. The size of spindle asters was determined by radially averaging the tubulin fluorescence intensity at different distances from the centrosome (denoted by gray half circles, n = 165). The normalized radial fluorescence intensities decay exponentially with distance from the centrosome—indicative of non-centrosomal microtubule nucleation (solid lines) and consistent with astral microtubules nucleated away from centrosomes. Error bars correspond to SDs. (E) The extent of microtubule nucleation in the spindle body (in black) and in the asters (in gray) increases linearly with spindle length (mean ± SD). |
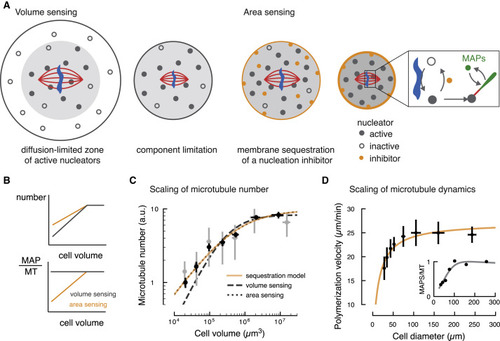
Figure 4. A Theoretical Model Based on Membrane Sequestration of a Microtubule Nucleation Inhibitor Accounts for Spindle Scaling (A) Left: schematic representation of the limiting component model (“volume sensing”). In large cells, the activation of nucleators (shown as filled circles) near chromosomes is limited by diffusion. As cell size decreases below the diffusion-limited volume, the number of nucleators scale with cell volume. Right: schematic representation of the membrane sequestration model (“area sensing”). An inhibitor of microtubule nucleation (orange circle) is adsorbed at the cell boundary. Inset: activation of nucleators occurs around DNA (in blue), while an inhibitor of microtubule nucleation (orange) triggers its inactivation. Active nucleators can generate new microtubules (red line), to which microtubule-associated proteins (MAPs, in green) can bind. (B) Prediction of how volume sensing and area sensing affect microtubule number and dynamics. If both microtubule number and factors promoting microtubule growth (MAPs) scale equally with cell volume, their ratio remains constant. Only if they scale differently with cell size, their ratio changes and microtubule dynamics may change. (C) Microtubule number is sensitive to the surface area of the cell and it is accounted by the membrane sequestration model (see Figure 3A and STAR Methods, orange line). Data taken from Figure 3A. (D) The membrane sequestration model (orange line) captures the change in polymerization velocity with cell size (see Figure 2A and STAR Methods, mean ± SD). Inset: the number of MAPs per microtubule decreases with decreasing cell diameter. MT, microtubule. |
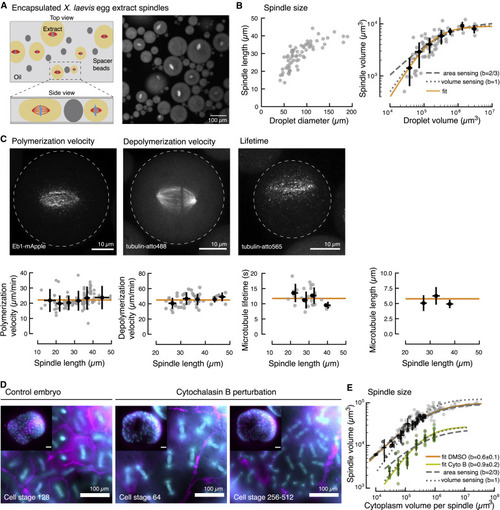
Figure 5. Spindle Scaling in Encapsulated Xenopus Egg Extracts and Cytokinesis-Inhibited Zebrafish Embryos (A) Spindle assembly in cell-like compartments by encapsulating Xenopus laevis egg extract in inert oil. Droplets are compressed between spacer beads to improve image quality and spindle orientation. Microtubules are labeled with tubulin-atto488. (B) Spindle scaling with droplet size is consistent with a simple limiting component model in the absence of membrane partitioning. Left: spindle length in encapsulated Xenopus laevis egg extract scales with droplet diameter. Each dot denotes an individual measurement (n = 77). Right: spindle volume scales linearly with droplet volume (gray dotted line and fit in orange). (C) Microtubule dynamics remain constant over a large range of spindle sizes in encapsulated Xenopus laevis egg extract (see also Video S6). Altogether these measurements determine the average microtubule length in the spindle (right). Gray dots denote individual measurements (n= 32, 48, and 27), and black dots are averages over 5 μm spindle size intervals. Error bars show SDs. The orange lines show the average values. (D) Pharmacological inhibition of cytokinesis using cytochalasin B in zebrafish embryos prevents the formation of new cell boundaries leading to spindles sharing the same cytoplasm. Left: a control embryo at cell stage 128 shows normal cellularization (spindles in cyan and cell boundary in magenta). Right: a perturbed zebrafish embryo at two distinct cell stages showing that new boundaries are not formed (cytochalasin B was added at cell stage 8), but spindles continue to divide and scale as they share the embryo cytoplasm. (E) Spindle scaling in control DMSO condition scales as the cell boundary (dark gray points, n = 41) whereas in the cytochalasin B perturbation, spindles scale linearly with the volume per spindle (green points, n = 69). The overall amplitude of spindle volumes is additionally decreased in the cytochalasin B condition, consistent with surface sequestration of a microtubule nucleation inhibitor. As reference, data from embryos without DMSO or cytochalasin B treatment is shown in light gray. |

Figure 6. Hierarchical Regulation of Spindle Scaling Schematics of the different regimes of spindle scaling. For large cells, spindles reach an upper limit because activation and availability of microtubule nucleators is restricted to a reaction-diffusion volume. Below this volume, spindles scale with cell size by regulating microtubule number, which depends on the surface area of the cell through the sequestration of a microtubule nucleation inhibitor. When the surface to volume ratio exceeds a critical value, components that regulate microtubule dynamics become limiting, leading to a change in microtubule length for small cells. |