
Figure 6—figure supplement 1
- ID
- ZDB-FIG-210208-107
- Publication
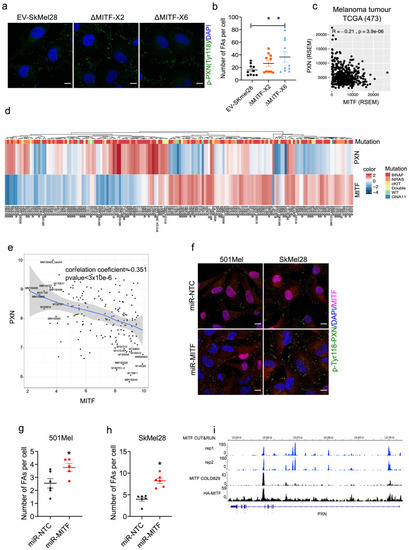
- Dilshat et al., 2021 - MITF reprograms the extracellular matrix and focal adhesion in melanoma
- Other Figures
- All Figure Page
- Back to All Figure Page
(
|