Figure 4
- ID
- ZDB-FIG-210208-104
- Publication
- Dilshat et al., 2021 - MITF reprograms the extracellular matrix and focal adhesion in melanoma
- Other Figures
- All Figure Page
- Back to All Figure Page
|
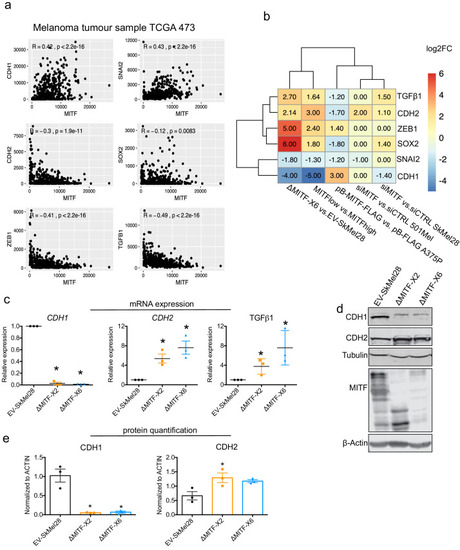
Epithelial-to-mesenchymal transition (EMT) genes are directly regulated by MITF. (a) Scatter plot displaying the Spearman correlation between MITF mRNA expression with EMT genes in the 472 melanoma tumor samples from TCGA; MITF displayed positive correlation with CDH1 and SNAI2 and negative correlation with ZEB1, TGFß1, and CDH2. (b) Differentially expressed EMT genes plotted as heatmap using the log2 fold change value of DEGs of MITF depletion in SkMel28 and 501Mel cells, MITF overexpression in A375P cells and MITFlow&high melanoma tumors. (c) Real-time qPCR (RT-qPCR) evaluation of EMT genes in the EV-SkMel28, ?MITF-X2, and ?MITF-X6 cell lines. Fold change in the expression calculated over EV-SkMel28. Error bar represents standard error of the mean (* p value <0.05) was calculated using one-way ANOVA (multiple correction with Dunnett test). (d, e) Western blot analysis and quantification (Fiji Image J) of protein expression of CDH1, CDH2, and MITF in EV-SkMel28, ?MITF-X2, and ?MITF-X6 cell lines. ß-Actin was used as loading control. * p value <0.05 was calculated by one-way ANOVA (multiple correction with Dunnett test). |

