
Figure 6
- ID
- ZDB-FIG-210208-106
- Publication
- Dilshat et al., 2021 - MITF reprograms the extracellular matrix and focal adhesion in melanoma
- Other Figures
- All Figure Page
- Back to All Figure Page
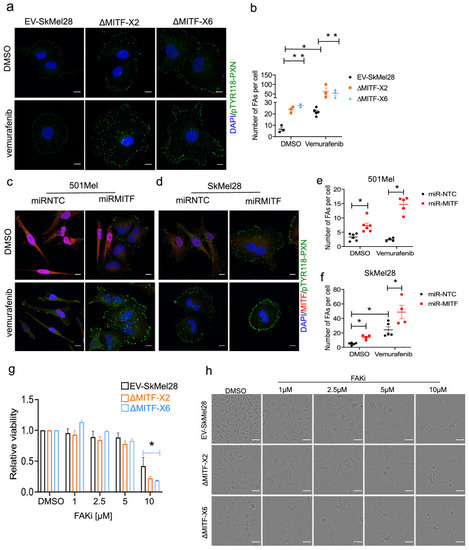
MITF mediates formation of focal adhesion. (a–b) Immunostaining for p-PXNTYR118 and quantification of p-PXNTYR118-positive focal points in EV-SkMel28, ∆MITF-X2 and ∆MITF-X6 cell lines treated with DMSO (a, upper panel) or vemurafenib (a, lower panel). (c–d) Immunostaining for p-PXNTYR118 and MITF and (e, f) quantification of p-PXNTYR118-positive focal points in miR-NTC and miR-MITF treated 501Mel and SkMel28 cells. Error bars represent standard error of the mean, * p value <0.05 was calculated by two-way ANOVA (multiple correction with Sidak test). (g) Bar plot represents the relative viable cells compared to DMSO control with increasing concentration of FAK inhibitor (PF562271) for 72 hr. Error bars represent standard error of the mean, * p value <0.05 was calculated by two-way ANOVA (multiple correction with Tukey test). (h) Incucyte images of cells after 72 hr treatment with increasing concentrations of FAKi (PF562271) and with respective DMSO control. |