
FIGURE
Fig. 4
- ID
- ZDB-FIG-200924-36
- Publication
- Oyarbide et al., 2020 - Loss of Sbds in zebrafish leads to neutropenia and pancreas and liver atrophy
- Other Figures
- All Figure Page
- Back to All Figure Page
Fig. 4
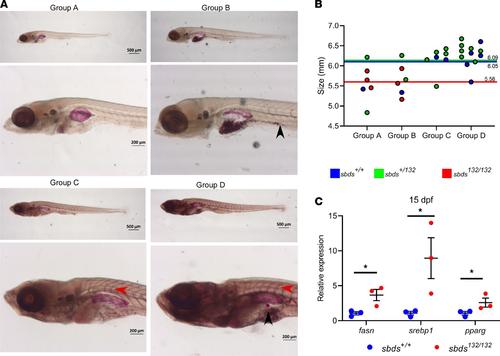
(A) Oil Red O (ORO) staining for neutral lipid accumulation: different groups depending on ORO staining. Red arrow shows lipid accumulation in the blood vessels; lipid droplets are indicated by a black arrow. (B) Size distribution and genotypes depending on the ORO staining. Colored lines show the mean SL for each group. (C) Gene expression of lipid metabolism markers in 15 dpf larvae. Statistical analysis was performed using the t test. *P < 0.05. |
Expression Data
| Genes: | |
|---|---|
| Fish: | |
| Anatomical Term: | |
| Stage: | Days 14-20 |
Expression Detail
Antibody Labeling
Phenotype Data
| Fish: | |
|---|---|
| Observed In: | |
| Stage: | Days 14-20 |
Phenotype Detail
Acknowledgments
This image is the copyrighted work of the attributed author or publisher, and
ZFIN has permission only to display this image to its users.
Additional permissions should be obtained from the applicable author or publisher of the image.
Full text @ JCI Insight