
Figure 5
- ID
- ZDB-FIG-200523-65
- Publication
- Kuil et al., 2020 - Zebrafish macrophage developmental arrest underlies depletion of microglia and reveals Csf1r-independent metaphocytes
- Other Figures
- All Figure Page
- Back to All Figure Page
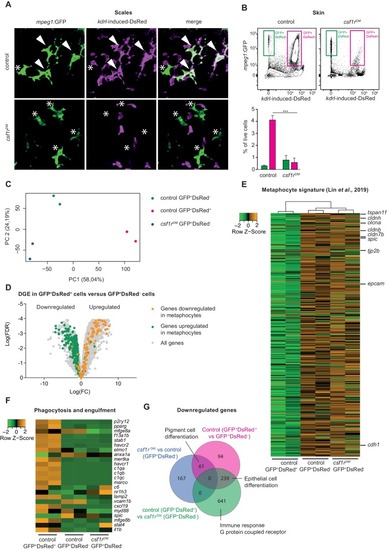
Amoeboid mpeg1+ cells in the zebrafish skin are of non-hematopoietic origin and have a metaphocyte transcriptome.(A) Immunofluorescence on manually dissected scales from adult skin of control and csf1rDMmpeg1:EGFP +; kdrl-induced-DsRed+ adults (4 mpf). Stars: single-positive (SP) cells; white arrowheads: double-positive (DP) cells. (B) FACS analysis on cells from the adult skin (4 mpf, n = 3 per group) and quantification. GFP+DsRed-=mpeg1+ only, GFP+DsRed+=mpeg1+/kdrl-induced-DsRed+. (C) PCA analysis showing segregatin based on cell type (PC1) and genotype (PC2). (D) Volcano plot showing gene expression changes between control GFP+DsRed+ versus GFP+DsRed- cells. Light grey: DGE of all genes, Green: DGE of genes enriched in metaphocytes logFC >2 (Lin et al., 2019); Orange: DGE of genes downregulated in metaphocytes logFC <2 (Lin et al., 2019). (E) Heat map showing the expression of metaphocyte signature genes. (F) Heat map showing the expression of phagocytosis and engulfment genes. (G) Venn diagram showing DGE between the three groups (logFC > |2|; FDR < 0.05). |