
Figure 1
- ID
- ZDB-FIG-200523-58
- Publication
- Kuil et al., 2020 - Zebrafish macrophage developmental arrest underlies depletion of microglia and reveals Csf1r-independent metaphocytes
- Other Figures
- All Figure Page
- Back to All Figure Page
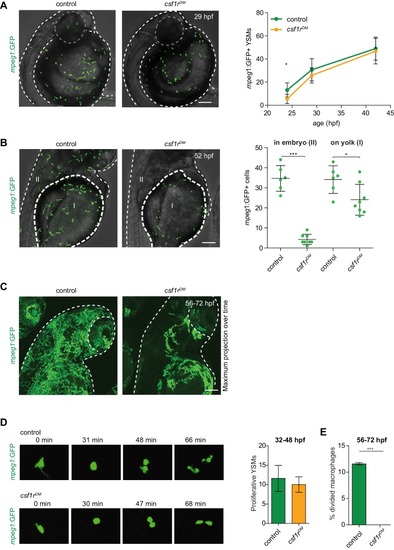
mpeg1+ primitive macrophages on the yolk in control and csf1rDM larvae.(A) Representative images of mpeg1+ macrophages located on the yolk (29 hpf) and quantification of mpeg1+ cell numbers over time. (B) Representative images of mpeg1+ positive primitive macrophages at 52 hpf. The dotted line indicates the border between the yolk (I) and the embryonic tissue (II). Quantification of mpeg1+ macrophages that colonized the tissue (II) and primitive macrophages located on the yolk (I). (C) Representative maximum projection of long term time lapse imaging of control and csf1rDM larvae showing migratory trajectories of mpeg1+ macrophages. (D) Snap shots from dividing mpeg1+ primitive macrophages in control and csf1rDM larvae (~36 hpf) and quantification of proliferative primitive macrophages during 16 hr time lapse imaging (~32 hpf – 48 hpf) (control n = 5, csf1rDM n = 3). (E) Quantification of fraction proliferative embryonic macrophages during 16 hr time lapse imaging (~56 hpf – 72 hpf) in control and csf1rDM larvae (n = 3 per group). Scale bars represent 100 µM. Error bars represent standard deviation. Statistical significance is calculated using one-way ANOVA with Dunnett’s multiple comparison test or Student’s t-tests *<0.05 **<0.01 ***<0.001. mpeg1+ cells were quantified on one side of the embryo (right side). Each dot represents one fish. |