
Figure 4
- ID
- ZDB-FIG-200523-63
- Publication
- Kuil et al., 2020 - Zebrafish macrophage developmental arrest underlies depletion of microglia and reveals Csf1r-independent metaphocytes
- Other Figures
- All Figure Page
- Back to All Figure Page
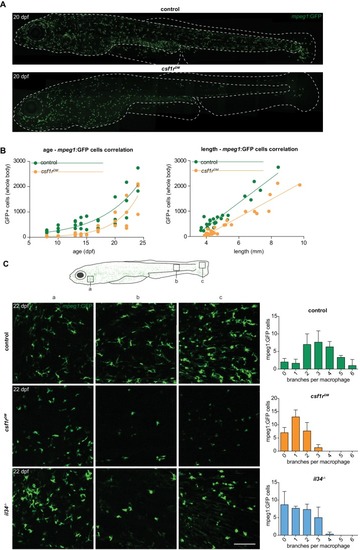
Two morphologically distinct populations of mpeg1+ cells in emerge from 15 dpf in the zebrafish skin.(A) Representative images of a control and csf1rDM zebrafish at 20 dpf. Dotted line represents the outline of the fish and its eye. (B) Quantification of the total number of mpeg1+ cells at one unilateral side of the fish at different time points between 8 and 24 dpf. The number of mpeg1+ cells was manually counted from the unilateral side presented in panel A. Plot showing the relationship between number of mpeg1+ cells and fish size. Each dot represents one fish. (C) Representative images of mpeg1+ cells in different body regions at 22 dpf showing differences in morphology between controls and csf1rDM or il34-/-mpeg1+ cells (n = 3 per group). Error bars represent standard deviation. Mpeg1+ cells were quantified on one side of the embryo (right side). |