|
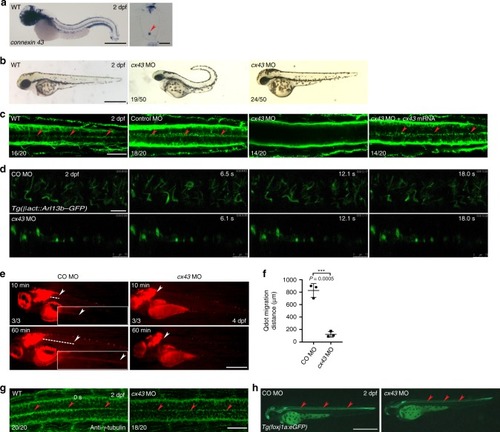
Cx43 is implicated in the maintenance of ependymal motile cilia.a WISH of a WT embryo at 2 dpf with cx43 riboprobes (left). Lateral view anterior to the left. Right panel shows the cross-section image of the SC ventral to the bottom. Arrowhead indicates ECs. Scale bars = left: 650 μm; right: 20 μm. b Embryos at one-cell stage were microinjected with cx43 MO and imaged at 2 dpf. Lateral view anterior to the left. Scale bar = 650 μm. c Embryos at one-cell stage were microinjected with either control MO or cx43 MO or cx43 MO + mouse Cx43 mRNA, and IF stained with anti-acetylated α-tubulin antibody at 2 dpf. Arrowheads represent spinal motile cilia. Dorsal view anterior to the left. Scale bar = 20 μm. dTg(bactin2:Arl13b-GFP) embryos expressing GFP in motile cilia were microinjected at one-cell stage with either control (CO) MO or cx43 MO and subjected to time-lapse imaging for 2 min (6.7 frames s−1) with an intravital multiphoton microscope. Dorsal view anterior to the left. Scale bar = 7.5 μm. e Embryos at one-cell stage were microinjected with control MO or cx43 MO and Qdots were microinjected into the hindbrain ventricles of larvae at 4 dpf, which were then imaged at 10 min and 60 min after the microinjection. Dashed lines indicate migration of Qdots. Arrowheads mark the caudal end of Qdot flow. Lateral view anterior to the left. Scale bar = 650 μm. Insets represent magnifications of the dotted areas. CO: Control. f Quantification of Qdot migration distance in the larvae shown in d. Mean ± SD. ***P < 0.001 by two-tailed unpaired Student’s t test (n = 3 larvae per group). g Embryos at one-cell stage were microinjected with either control MO or cx43 MO and immunostained with anti-γ-tubulin antibody at 2 dpf. Arrowheads indicate motile cilia. Dorsal view anterior to the left. Scale bar = 20 μm. hTg(foxj1a:eGFP) embryos expressing GFP in ECs were microinjected with either control MO or cx43 MO and imaged at 2 dpf. Arrowheads represent spinal ECs. Dorsal view anterior to the left. Scale bar = 650 μm.
|