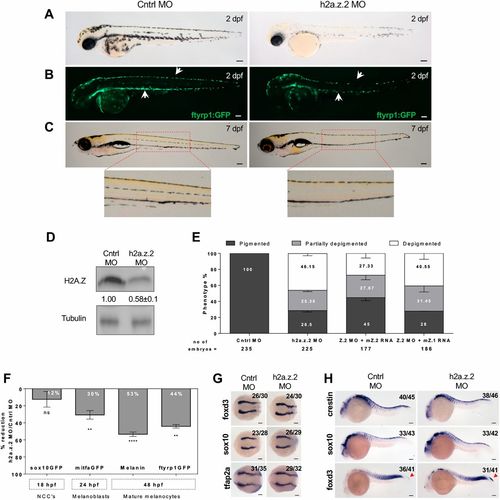
H2a.z.2 controls melanocyte numbers during zebrafish development. (A) Bright-field images of control MO- and H2a.z.2 MO-injected embryos (Z2 MO) at 2 days postfertilization (dpf). (B) Fluorescence images of Tg(ftyrp1:GFP) that tags differentiating melanophores, in control and Z2 MO embryos at 2 dpf. White arrows indicate the dorsal and ventral stripe of melanophores. (C) Bright-field images of control and Z2 MO at 7 dpf. Insets show enlarged views of the lateral line melanophores. (D) Western blot analysis of control and Z2 MO embryos at 2 dpf, carried out using an antibody that recognizes both H2A.Z.1 and H2A.Z.2 proteins, referred to together as H2AZ. Numbers refer to fold change normalized to H3. (E) Bar graphs represent mean±s.e.m. percentage of embryos with varying degrees of pigmentation: depigmented (<20 head melanophores), partially pigmented (21-39 head melanophores) and normally pigmented (40 and above). These were scored manually at 2 dpf, from embryos injected with control MO, Z2 MO, Z2 MO along with mouse H2a.z.1 mRNA or mouse H2a.z.2 mRNA across three independent biological replicates. Number of embryos analysed is given under the bars. (F) Inverted bar graphs represent mean±s.e.m. (n=3) percentage reduction in cell numbers of Z2 MO, compared with the control, in various marker lines. Time of assessment of labelled cells, their identity and the transgenic line used are indicated. (G) Whole-mount RNA in situ hybridization (WISH) assay showing the expression pattern of early neural crest markers foxd3, sox10 and tfap2a at 11 hpf. The assay resulted in the staining of migrating neural crest cells, which remained unaltered in the Z2 MO. (H) WISH-based expression pattern of neural crest markers crestin, sox10 and foxd3 at 24 hpf. Arrowheads in the foxd3 panel indicate tail tip neural crest cells. The numbers in the WISH images indicate frequency of the represented phenotype in the total number of embryos analysed. Scale bars: 100 μm.
|
