
FIGURE
Figure 6.
- ID
- ZDB-FIG-190723-638
- Publication
- Oh et al., 2019 - Zebrafish model of KRAS-initiated pancreatic endocrine tumor
- Other Figures
- All Figure Page
- Back to All Figure Page
Figure 6.
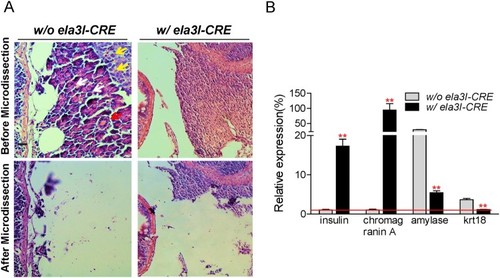
Molecular characterization of pancreatic tumors at 6 and 12 months of age. (A) To further classify the origin of pancreatic tumors, microdissection was performed. As a control, the pancreas region from the age-matched adult fish in the control group (w/o |
Expression Data
| Genes: | |
|---|---|
| Fish: | |
| Anatomical Term: | |
| Stage: | Adult |
Expression Detail
Antibody Labeling
Phenotype Data
| Fish: | |
|---|---|
| Observed In: | |
| Stage: | Adult |
Phenotype Detail
Acknowledgments
This image is the copyrighted work of the attributed author or publisher, and
ZFIN has permission only to display this image to its users.
Additional permissions should be obtained from the applicable author or publisher of the image.
Full text @ Animal Cells Syst (Seoul)