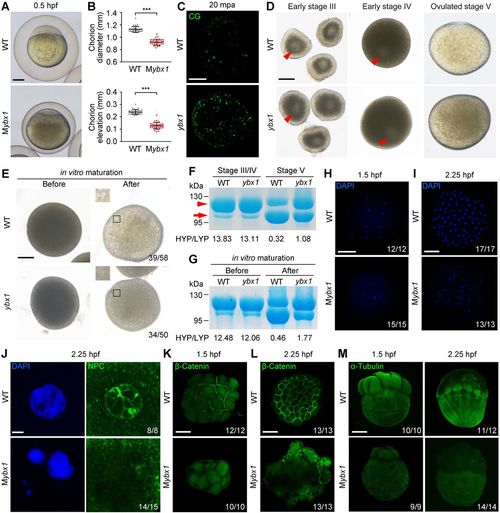
Characterization of Mybx1 mutant phenotype. (A) WT and Mybx1 embryos with chorions at 0.5 hpf. (B) Measurement of chorion diameters and chorion elevation distances at 0.5 hpf. ***P<0.001; n=33; Welch's t-test. (C) Representative images showing labelling of cortical granules (CG) in WT and ybx1 mutant eggs fixed at 20 min post-activation (mpa). Lateral views of eggs are shown. Eggs observed: WT n=23, mutant n=28. (D) Early stage-III oocytes, early stage-IV oocytes and ovulated stage-V eggs from WT and Zybx1 female fish. Arrowheads indicate germinal vesicles (oocyte nuclei) in the centre of stage-III oocytes and closer to the cortex in stage-IV oocytes. (E) WT and ybx1 mutant oocytes before and after in vitro maturation. Insets show enlarged regions of the yolk. Relative opaqueness is seen in ybx1 mutants. (F) SDS-PAGE and Coomassie staining of major yolk proteins of stage-III/IV oocytes and stage-V eggs. The higher and lower molecular weight yolk proteins (HYP and LYP) are indicated by the arrowhead and arrow, respectively. HYP/LYP ratios were calculated to represent yolk protein cleavage levels. (G) Major yolk protein cleavage in oocytes before and after in vitro maturation. Three independent experiments were performed for F and G. (H,I) Whole-mount DAPI staining of WT and Mybx1 embryos at 1.5 hpf (H) and 2.25 hpf (I) shown in animal pole views. (J) DAPI staining and NPC immunofluorescence in 2.25 hpf embryos. (K,L) β-Catenin membrane immunofluorescence in 1.5 hpf (K) and 2.25 hpf (L) embryos shown in animal pole views. (M) α-Tubulin immunofluorescence in 1.5 hpf and 2.25 hpf embryos shown in lateral views. Numbers of observations are indicated in H-M. H shows inverted fluorescence microscopic images. I,K,M show maximum intensity projections of confocal z-slices. J and L show individual confocal planes. Scale bars: 200 μm in A,C-E,H,I,K-M; 5 μm in J.
|
