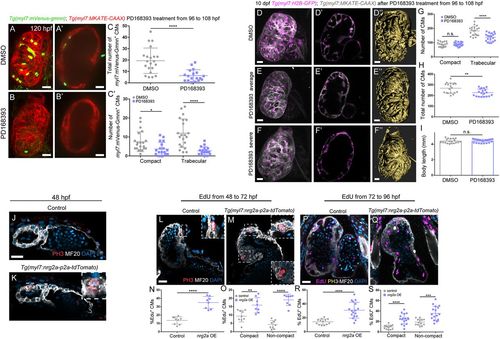
Erbb2 signaling controls cardiomyocyte proliferation and trabecular growth. (A-C′) Treatment of Tg(myl7:mVenus-gmnn); Tg(myl7:MKATE-CAAX) larvae with DMSO control or the Erbb2 inhibitor PD168393 from 96 to 108 hpf (A and B show 3D reconstruction of control and treated hearts; A′ and B′ show cross-sections). (C) Quantification of the total number of myl7:mVenus-Gmnn+ cardiomyocytes and (C′) the number of myl7:mVenus-Gmnn+ cardiomyocytes in the compact and trabecular layers after 12 h of treatment. There is a decrease in the total number of proliferative cardiomyocytes, particularly in the trabecular layer; each point represents a heart. (D-F″) Images of 10 dpf Tg(myl7: H2B-EGFP); Tg(myl7:MKATE-CAAX) larvae that have been treated with DMSO control or PD168393 from 96 to 108 hpf. The number of cardiomyocytes observed in the trabecular layer is reduced (compare D′ with E′), and a simplified trabecular network is formed in PD168393-treated larval hearts (compare 3D surface rendering D″ with E″). In the most severe cases, trabeculae do not project into the lumen, and trabecular cardiomyocytes stay close to the compact layer (compare D′,D″ with F′,F″). (G,H) Quantification of the number of cardiomyocytes in control and PD168393-treated larvae. While the number of compact layer cardiomyocytes remains unchanged, the number of trabecular cardiomyocytes is significantly reduced (G), resulting in an overall reduction in the number of cardiomyocytes in treated hearts. Each point represents a heart. (I) The body length of these larvae is not affected (each point represent a larva). (J,K) Phospho-histone 3 (PH3) staining of 48 hpf Tg(myl7:nrg2a-p2a-tdTomato) hearts. More PH3+ cardiomyocytes are observed in nrg2a-overexpressing hearts compared with control and some cardiomyocytes divide from the compact layer towards the lumen (K, inset). (L-S) Hearts incubated with EdU for 24 h, from 48 to 72 hpf (L-O) or from 72 to 96 hpf (P-S), and stained for PH3. Divisions perpendicular to the compact layer towards the lumen are detected (M, details) in nrg2a-overexpressing cardiomyocytes, in contrast to control, where only parallel divisions can be observed (L, inset). An increased rate of proliferation in nrg2a-overexpressing cardiomyocytes is observed in both compact and non-compact layers; each point represents a heart (N,O,R,S). Data are mean±s.d., ****P<0.0001 in C,C',G,N,O,R,S, *P=0.0122 in C′, **P=0.0033 in H, **P=0.0056 in O, ***P=0.0003 in S; Student's two-tailed t-test. Experiments in A-C',J-S were repeated twice, experiments in D-I were repeated three times. Scale bars: 20 µm. Scale bars in J,L,P apply to K,M,Q, respectively.
|
