
Fig. S8
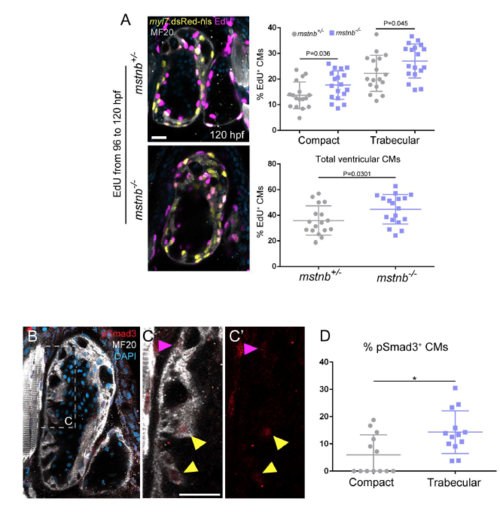
mstnb mutants exhibit increased cardiomyocyte proliferation in both compact and trabecular layers. (A) images of 120 hpf Tg(myl7:nlsDsRed) mstnb+/- and mstnb-/- larcae stained for EdU, MHC and DsRed after 24 hours of EdU incubation. In the mutants, both compact and trabecular cardiomyocytes exhibit a moder increase in their proliferative rates (results are mean S.D., compact layer, *P=0.036, trabecular layer, *P=0.045; total number, *P=0.0301; Student's two-tailed t-test; experiment was repeated 3 times). (B) pSmad3 immunostaining on 120 hpf wild-type hearts; myosin heavy chain staining labels cardiomyocytes. (C-C') Close-up of the outer curvature of the ventricle, where trabecular (yellow arrowheads) and compact (purple arrowhead) pSmad+ cardiomyocytes are observed. (D) Quantification of the percent of pSmad+ cardiomyocytes in the compact and trabecular layers; each point represents a heart. *P=0.01; Student's two-tailed t-test; experiment was repeated two times. Scale bars, 20 µm. |
| Fish: | |
|---|---|
| Observed In: | |
| Stage: | Day 5 |