
Fig. 3
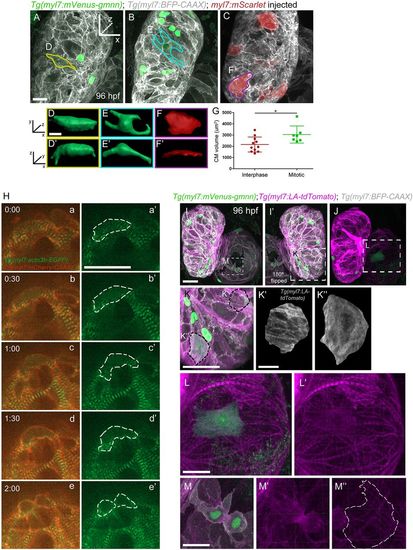
Sarcomere disassembly, as well as cell shape and volume changes, are observed before cardiomyocyte division. (A-C) Three-dimensional reconstruction of 96 hpf Tg(myl7:mVenus-gmnn); Tg(myl7:BFP-CAAX) larvae injected with myl7:mScarlet plasmid to label individual cardiomyocytes; (D-F′) the cardiomyocytes used for 3D surface rendering are outlined in A-C. (D-F′) Three-dimensional surface rendering of individual mitotic (D-E′) and interphase (F,F′) cardiomyocytes. The thickness of the mitotic cardiomyocytes is increased and their shape appears more rounded. (G) Measurement of the cell volume of mitotic and interphase cardiomyocytes located in the outer curvature of the heart, as measured through the mVenus-Gmnn or mScarlet signal; each point represents a cardiomyocyte from seven different larvae. Data are mean±s.d., *P=0.0266; Student's two-tailed t-test. (H) Time-lapse imaging of beating Tg(myl7:actn3b-EGFP); Tg(myl7:mCherry-CAAX) hearts starting at 80 hpf. Dashed line outlines the dividing cardiomyocyte. The organized sarcomeric pattern (a,a′) becomes gradually lost (b-c′) and the Actn3b-EGFP signal is detected close to the borders of the cardiomyocyte (d,d′) prior to its division (e,e′). Five larvae imaged; four cardiomyocytes were seen completing their division. (I-J) Three-dimensional reconstruction of 96 hpf Tg(myl7:mVenus-gmnn); Tg(myl7:LA-tdTomato); Tg(myl7:BFP-CAAX) hearts (12 larvae imaged). I′ is a mirror image of I. (K) Higher magnification of the ventricular region outlined in I′. An individual interphase cardiomyocyte exhibits an organized striated pattern of sarcomeres (K′), whereas in a dividing cardiomyocyte, the organized pattern is lost and the fluorescent signal appears more diffuse (K″). (L,L′) Higher magnification of the atrial area outlined in J, where sarcomere disassembly is clearly visible in a dividing cardiomyocyte (L′). (M-M″) Details of a dividing cardiomyocyte in the atrium that appears to be undergoing cytokinesis. Organized sarcomeric structures are absent, in contrast to neighboring cardiomyocytes (M″). Scale bars: 20 µm in A,H,I,K,L,M; 5 µm in D,K′. Bars in I,K′,L and M apply to I-J,K″,L′ and M′,M″. |
| Genes: | |
|---|---|
| Fish: | |
| Anatomical Terms: | |
| Stage Range: | Protruding-mouth to Day 4 |